

Nonparametric Statistics on Data Cloud and Manifolds
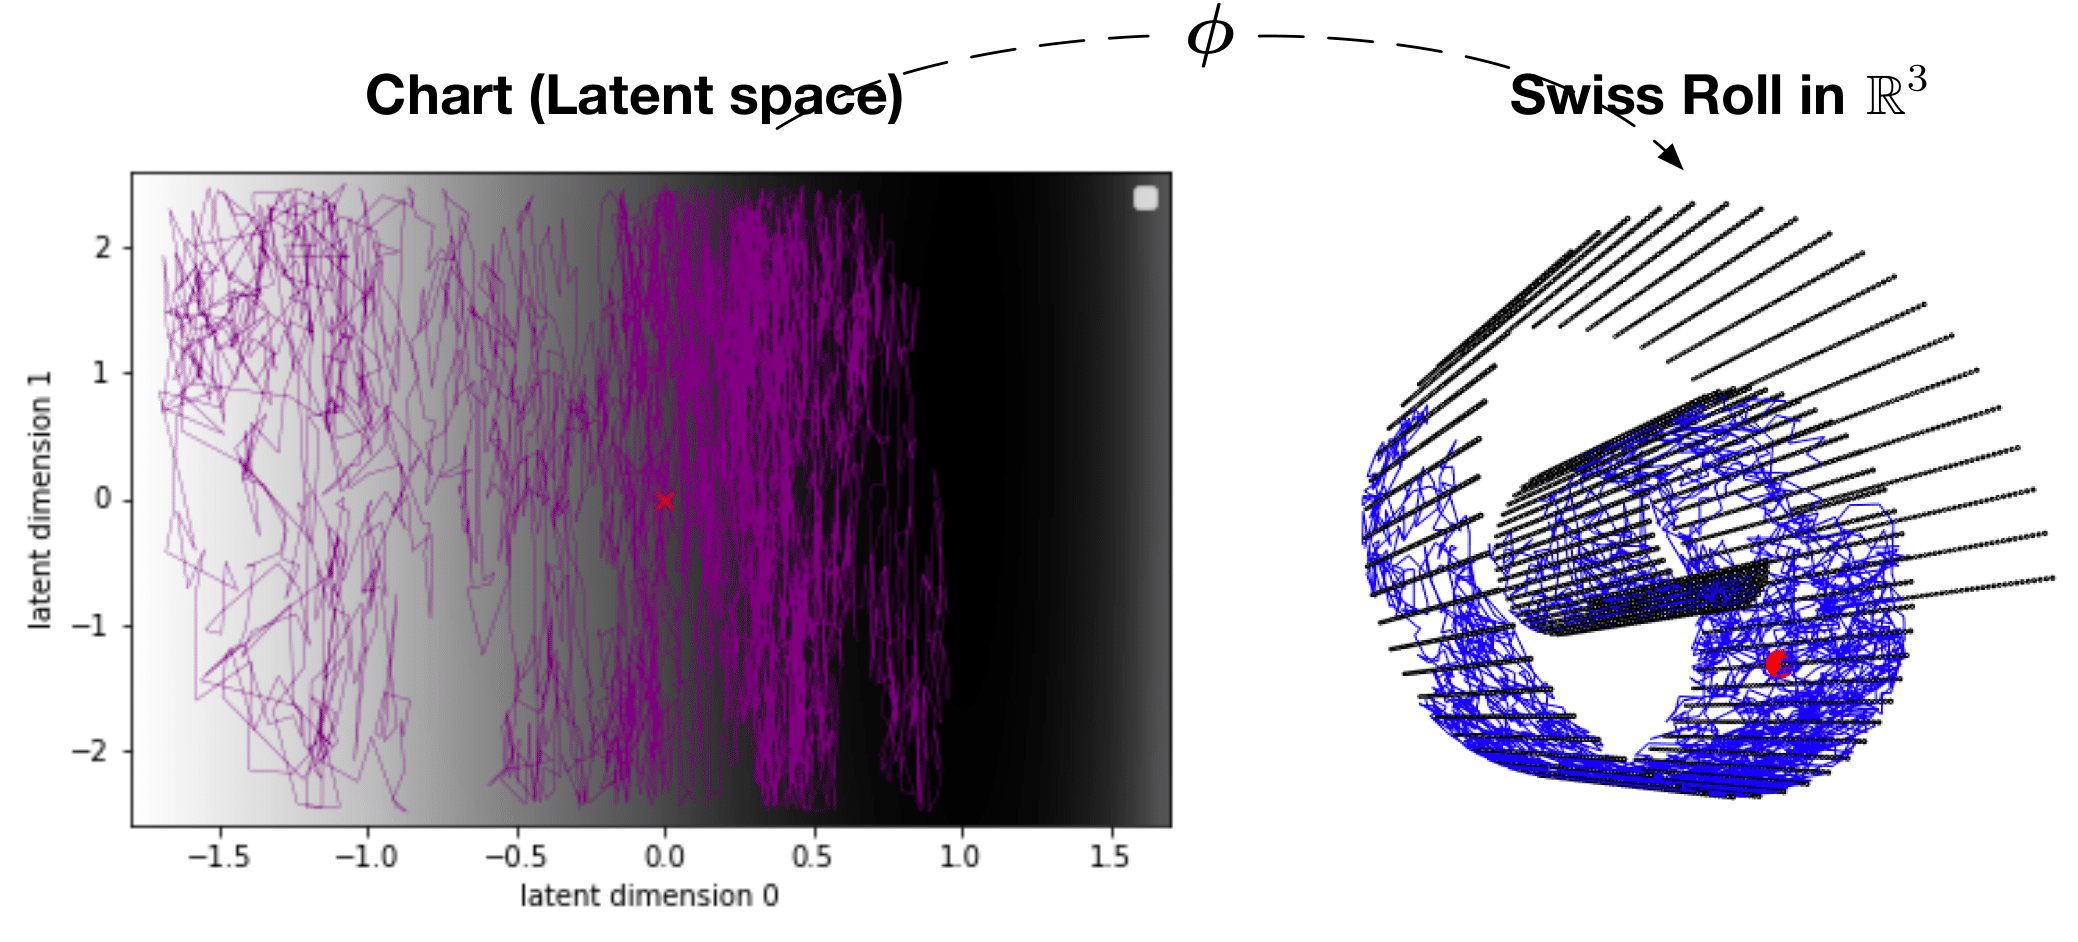
A Brownian Motion sample path (blue line, right panel) on $M$ (Swiss roll in $R^3$) and its equivalent stochastic process (purple line, left panel) in the chart (or latent space) in $\mathbb{R}^2$. $\phi: \mathbb{R}^2 \rightarrow M \subset R^3$ is a parametrization of $M$. The purple line in the chart is simulated as a stochastic process in the latent space. Its mapping in $R^3$ is the blue line on the Swiss roll. The red dot is the starting location of the Brownian Motion trajectory. The horizontal axis of the latent space represents the radius of Swiss roll. The vertical axis is for the width. The gray color in the latent space indicates the magnification factor. When the latent space is mapped to $M \subset R^3$, the darker region will be stretched more. The latent space is learned using a dataset of 450 points. (see Niu et al. (2023) for more details.)

Researchers
Publications
- Intrinsic Gaussian Process on Unknown Manifolds with Probabilistic Metrics. Journal of Machine Learning Research, 24(104), (2023).
- Intrinsic Gaussian processes on complex constrained domains. Journal of the Royal Statistical Society Series B: Statistical Methodology, 81(3), (2019).
- Extrinsic Gaussian processes for regression and classification on manifolds. Bayesian Analysis, 14(3), (2019).
- Extrinsic Bayesian Optimization on Manifolds. Algorithms, 16(2), (2023).
Grants