Measuring the Inclusive Economy
Published: 13 March 2024
A new comprehensive dataset for Great Britain's local authorities with interactive data maps - we discuss what this reveals about the fabric of economic inclusion across Great Britain.
SIPHER research has found clear evidence that more inclusive economies have better population health and lower health inequalities. At a time when economic growth takes priority, the strategic commitment by many local authorities to develop a more inclusive economy is a real beacon of hope. However, with no universally accepted definition of what constitutes an inclusive economy, the challenge lies in translating commitment into action and measuring success.
We believe that our SIPHER Inclusive Economy Dataset can help address these challenges and inform decision-making for a more equitable and healthy future for all of us.
Introducing the SIPHER Inclusive Economy Dataset
Launched in October 2023, the SIPHER Inclusive Economy (Local Authority Level) Dataset was developed to provide a meaningful collection of data that can be used by researchers and policy actors to explore the extent and nature of economic inclusion across local authorities in Great Britain.
Covering all 363 local authorities in England, Wales, and Scotland, this unique and comprehensive dataset offers inclusive economy and additional health and demographic indicators, providing valuable insights into regional disparities and opportunities for improvement. It allows policy analysts to track statistics over a five-year period (2017-2021) against a range of measures, and to benchmark performance against other parts of the country. With an interactive data visualisation tool, the dataset looks to support evidence-based decision-making and foster greater transparency.
Defining an Inclusive Economy
At SIPHER, our focus is on economic inclusion rather than economic growth. While growth is often invoked as the marker of success, inclusivity tends to emerge as a more potent driver of improved population health and reduced health inequalities.
However, defining what constitutes an inclusive economy remains a difficult task as various interpretations and metrics are involved. Our Inclusive Economy Dataset seeks to shed light on this by capturing a range of aspects and indicators including those related to housing and employment. This allows us to measure and compare multiple domains of people’s everyday lives across different geographic areas. It also allows us to explore how these aspects of economic inclusion are associated with health outcomes.
You can explore more detailed information on the motivation behind the creation of the dataset in a previous SIPHER blog post, What Is An Inclusive Economy – And How Do You Know If You’ve Got One? (published: August 2021).
Capturing Economic Inclusion
Our goal was to develop a collection of indicators which captures the core theoretical concept of economic inclusion without unnecessary complexity, and we were careful to consider the wide range of domains and potential indicators from which to measure economic inclusion. The resulting dataset is the outcome of an iterative consultation process between multiple SIPHER colleagues and researchers at the universities of Leeds, Glasgow and Manchester, together with policy partners, and experts on our Inclusive Economies and Housing Advisory Group.
To highlight the multifaceted nature of inclusivity, our focus was on sourcing data related to access to services and jobs, inclusion in decision-making, access to affordable housing, and disparities in earnings and wealth. This required us to navigate the complex landscape of Great Britain’s decentralised and devolved statistical bodies to access the diverse data sources needed.
The SIPHER Inclusive Economy Indicator Set: Technical paper [PDF] describes this process of identifying and selecting candidate indicators in detail.
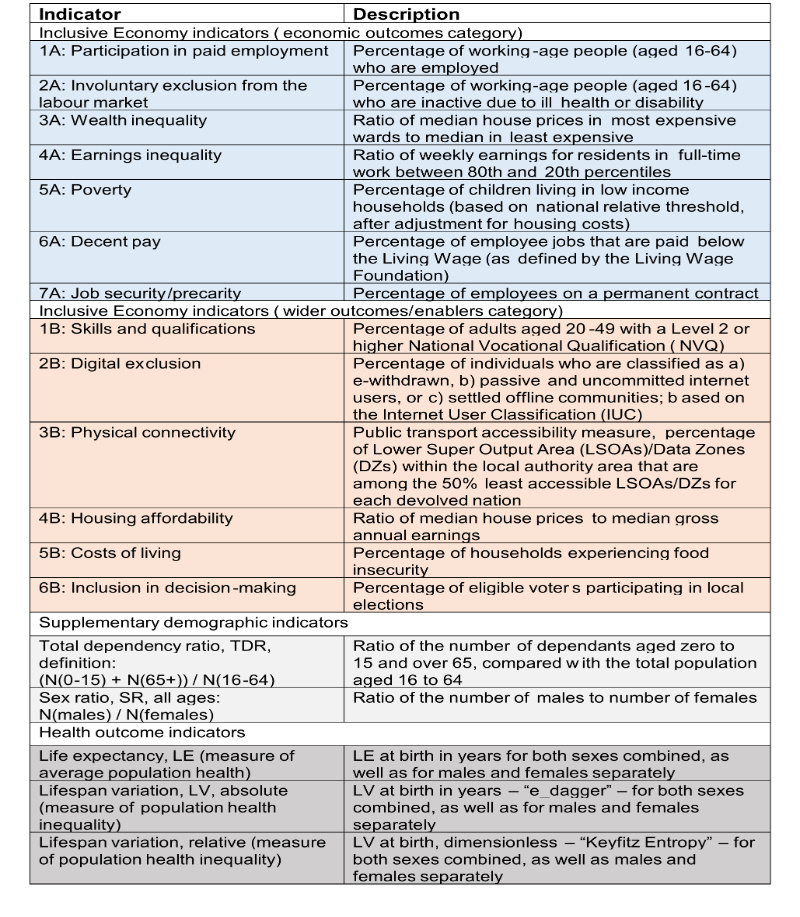
13 Inclusive Economy Indicators
Our dataset comprises 13 inclusive economy indicators presented in two groups: those directly related to economic outcomes and those related to wider outcomes and enablers of economic inclusion.
For example, Inclusive Economy Indicator 1A – which falls into the “economic outcomes” category – captures participation in paid employment. The metric we use for this indicator is the percentage of working-age people in employment, which is drawn from the Annual Population Survey.
See Table 1 for a summary of all 13 inclusive economy indicators captured in our dataset.
In addition to the 13 indicators capturing the inclusive economy, we have provided information on the demographic composition of the local authority population, reflected by the total dependency ratio and the sex ratio. To make the dataset as comprehensive as possible, we have also provided measures of population health (life expectancy) and population health inequality (lifespan variation). Together, these indicators offer a nuanced understanding of economic inclusion across Great Britain and its co-occurrence with the demographic structure of the population and different population health (inequality) outcomes.
Table 1 - Inclusive economy indicators and supplementary indicators
Exploring and Grouping Inclusive Economies
SIPHER Inclusive Economy Dataset (local authority level): Interactive Map allows exploration of this dataset.
Users can select the indicators of interest and then explore the presented map of Great Britain to reveal detailed insights for each local authority. The data can be viewed across a 5 year period (2017 - 2021) allowing dynamic shifts to be highlighted.
Hover over any local authority, and a pop-up will confirm its name along with its corresponding indicator score, providing instant clarity and context. With the ability to zoom in or pan across the map users can effortlessly locate areas of interest.
One of the key features of our dataset is its ability to cluster local authorities based on their level of economic inclusion.
Our four-cluster grouping not only reveals patterns of inequality, but also enables researchers to explore the nature of relationship between inclusivity and health outcomes and can provide evidence to support prioritising inclusivity in policy decisions - See Figure 1 Cluster Map.
Figure 1: Cluster map - Four-cluster k-means solution (2020)
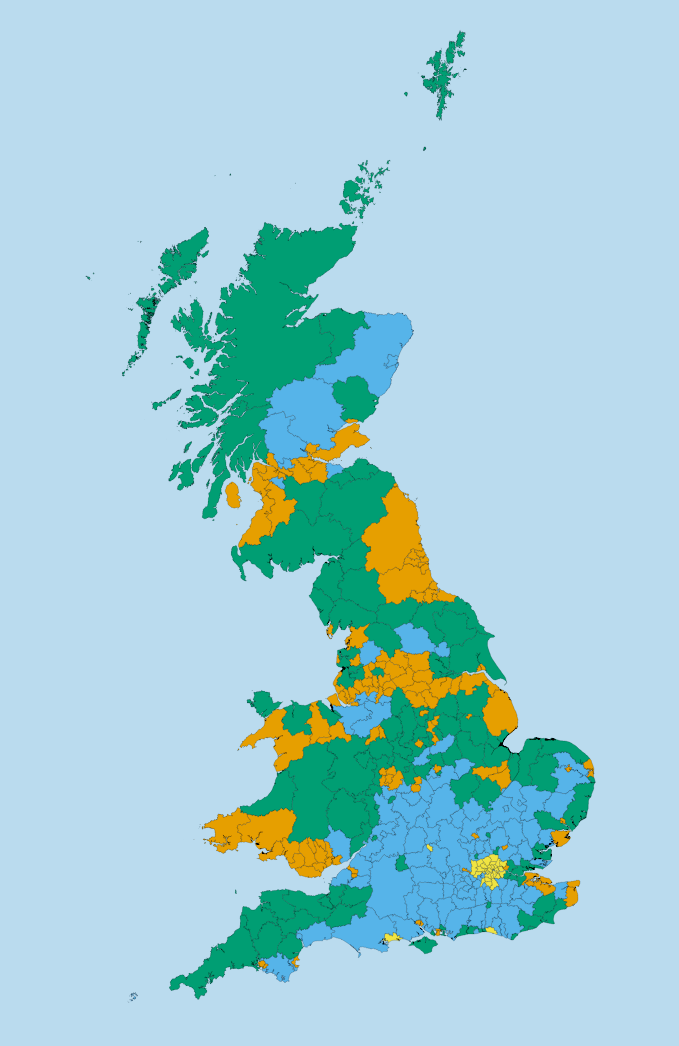
Key: 1 Orange - Less inclusive 2 Blue - More inclusive 3 Green - Average Inclusivity 4 Yellow - Mix of extremes
Towards a Healthier Future
SIPHER’s academic and policy partners have already been involved in a number of workshop discussions around this new dataset. These workshops underlined the dataset’s ability to help provide a better understanding of factors contributing to spatial health inequalities across Great Britain. We hope that our new dataset will uncover insights into economic inclusivity and pave the way for a better understanding of factors driving population health and health inequalities.
Our dataset is publicly available for downloaded via the Open Science Framework. We will continue to disseminate findings and seek new collaborations at local, regional, and national levels.
The views and opinions expressed in this blog are those of the author/authors.
Links and further reading:
- SIPHER Inclusive Economy (Local Authority Level) Dataset: summary with links to all related dataset resources including:
Inclusive Economy Dataset, Open-access resource at the Open Science Framework
SIPHER Inclusive Economy Dataset: Interactive Map
Product Guide - Inclusive Economy Dataset, Technical details of the dataset including strengths and limitations, and option to directly compare with other SIPHER products
Existing Indicator Sets Workbook [XLSX]: A detailed description of indicators proposed by policy partners during dataset development
- What is an Inclusive Economy - and how do you know if you've got one? SIPHER blog post (published: 20th August 2021)
- SIPHER Inclusive Economies and Housing Advisory Group, Experts and policy partners consulted during dataset development
- SIPHER Inclusive Economy Indicator Set: Technical paper [PDF], Details on dataset development process, revised June 2023
- Estimating quality-adjusted life expectancy (QALE) for local authorities in Great Britain and its association with indicators of the inclusive economy: a cross-sectional study BMJ Open March 2024
- Annual Population Survey (APS), ONS survey drawn on for dataset
- Inclusive Growth Indicators for Cities: considerations and options - Inclusive Growth Analysis Unit, University of Manchester, Ceri Hughes, Briefing Paper 6, August 2017 (PDF)
- Knowing the goal: an inclusive economy that can address the public health challenges of our time, Shipton D. et al., 2020, Epidemiology and Community Health 75 (11), pp. 1129-1132.
- Bold action is needed to strengthen primary prevention, Meier P. et al., 2023, British Medical Journal 380, p. 595 (2 p.).
-
Levelling up the UK: is the government serious about reducing regional inequalities in health? Ralston R, Smith K, Hill O’Connor C, Brown A. (2022) British Medical Journal 377 (4 p.) doi: https://doi.org/10.1136/bmj-2022-070589
First published: 13 March 2024
<< Blog