

What is an inclusive economy – and how do you know if you’ve got one?
Published: 20 August 2021
Examining the challenges of measuring for an inclusive economy and why we lack an 'industry standard’.
Measuring inclusive economies
Ever since the concept of inclusive growth (or more commonly now, inclusive economy) started to gain traction in the UK, policy makers and analysts have been grappling with challenges of measurement. Orthodox metrics for local and regional economic development, with their narrow focus on GDP, employment rates and human capital, are easy to challenge. But it is harder to work out what to put in their place. What indicators should we be monitoring to tell us whether the economy is more inclusive in Place A than in Place B, or at time point 2 compared with time point 1?
Numerous attempts have been made to develop such indicators (see Inclusive Growth Indicators for Cities: considerations and options - Briefing paper 6) for some leading examples) but no one set is seen as ‘industry standard’. So SIPHER has had to do its own thinking about which measures would best support its goal of mapping and modelling relationships between inclusive economies and health outcomes. Here we explain our approach.
Challenges
Anyone who has been engaged in indicator development around the slippery concept of inclusive economies will recognise both conceptual and practical challenges.
The inclusive growth (IG)/inclusive economy (IE) concept itself is both ill-defined and contested. A key bone of contention is the centrality of growth. While some advocates emphasise the importance of growth as well as inclusion (and the necessity of growth for inclusion), others prefer to concentrate on the extent of economic inclusion, regardless of the size of the economy. Indeed, some argue that this is an essential shift if we are to see the economy as the servant of wider social goals. IG/IE is also only one of a set of related ‘beyond GDP’ policy ideas. Wellbeing Economies and Doughnut Economics are increasingly commonly taken up, while some places are attracted by Community Wealth Building (CWB) and/or an emphasis on the Foundational Economy.
These ideas overlap and are not exclusive. Over the period that SIPHER has been working, at least one of our policy partners, the Scottish Government, has set out the ambition to deliver a Wellbeing Economy as a central policy motif. Wellbeing and environmental outcomes are positioned more strongly, but inclusive growth remains a core policy objective within the wellbeing economy framing, while CWB is seen as an important component and delivery mechanism of this.
These differences in emphasis matter for measurement. If our concept of an inclusive economy is one designed for economic inclusion, we might limit ourselves to indicators of inclusive economic outcomes. Or we might consider other dimensions such as housing, democratic participation or transport in so far as they are important enablers of economic inclusion. However, if our concept of an inclusive economy is one which delivers better and more broadly shared outcomes across the breadth of human and social life, then those broader dimensions might be seen as core outcome measures, with traditional economic outcomes such as employment enabling them, rather than the other way round.
Then there are the data challenges. One of the consequences of the UK’s (and England’s in particular) highly centralised system of government is very poor subnational data. Small survey sample sizes mean that even data as vital as that on incomes and wealth cannot routinely and reliably be reported at sub-regional level, and changes over time are particularly hard to estimate with confidence. Disaggregation even for large ‘equality groups’ (for example men/women or high-level ethnic categories) – fundamental in the concept of inclusion – is not always possible. And data collection has not always kept pace with the evolution of policy thinking. For example, we don’t yet have accurate measures of the local ownership of assets, or the proportion of businesses that operate as non-profits, or the extent of digital inclusion beyond whether people live in an area where there is high speed broadband.
SIPHER’s own approach adds a further challenge. Our indicators will need to be used in models and decision tools. Unlike organisations like the London Prosperity Board or Grant Thornton, or individual local or combined authorities which have developed inclusive growth performance frameworks with a very large number of indicators, SIPHER needs to find a small set which adequately capture the inclusive economy concept without being overly abundant and complex. A single measure (sitting above a broader set) would be the ultimate goal, although no broadly accepted single measure exists in the current inclusive growth literature.
Towards an indicator set
Our first step was to collate and compare existing indicator sets, both from SIPHER’s policy partners (as of early 2021) and wider organisations. This synthesis is available as SIPHER Existing Indicator Sets Workbook [XLSX].
From this we identified two central outcome domains of inclusive economies – participation in economic activity and more widely shared benefits – and some commonly used indicators for each of these. We also identified a broader set of domains which could sometimes be positioned as the outcomes of inclusive economies (the ultimate ends) and sometimes as enablers of economic inclusion. These included education, access to public services, housing and dimensions of place, the nature and of the economy and the economic infrastructure: connectivity, finance and support services.
A selection of indicators in each of these domains was shared within the SIPHER team, with SIPHER’s community panels and with our inclusive economy expert advisory group, and cross-checked against the system maps that were emerging from workshops in each of our policy partner areas - read SIPHER Blog Participatory Systems Mapping in a Socially Distanced World. A key point of discussion in all these forums was the issue of scope. Environmental sustainability and economic growth were of critical interest, as were health and well being outcomes, but they were not included in the indicator set.
Should they be? Ultimately we decided not.
Since our goal is to understand relationships between inclusive economies and health outcomes, the latter would not be treated as inclusive economy outcomes. Instead we focused on economic inclusion and its enablers.
Growth and sustainability were also seen as distinct from economic inclusion, enabling the synergies and trade-offs between them, and between each of them and inclusion inclusion, to be observed more clearly than if all were incorporated in a single inclusive economy concept. The broad consultation also produced consensus on specific indicators – for instance a proposed indicator on work-life balance was deleted because no one was convinced that it could only capture involuntary rather than voluntary over-work.
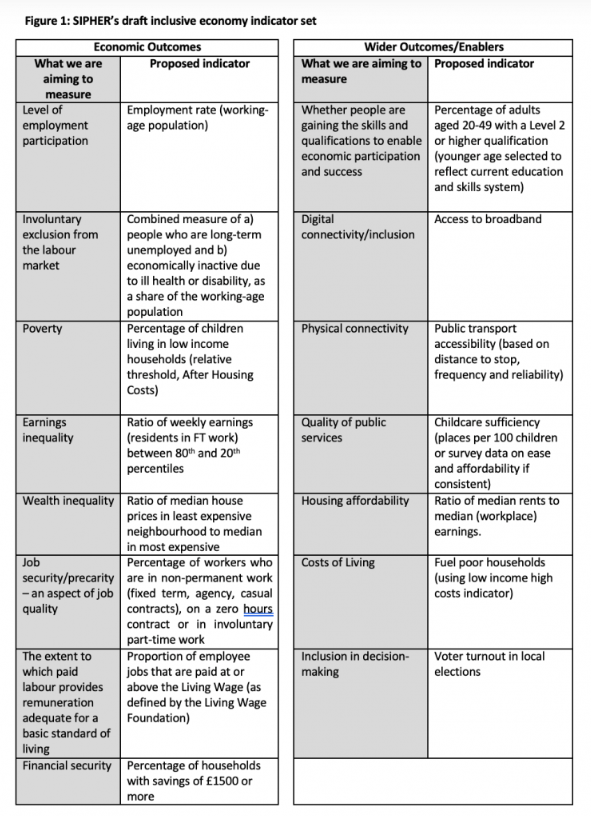
Our draft indicator set is shown below as Figure 1.
Next steps
Our current work takes us to the data challenges and the question of a single indicator. Building an initial dataset at different geographical scales will illuminate data availability and disaggregation issues, possibly leading to some refinement of the indicator set. We are also experimenting with using a cluster methodology to categories places according to their inclusive economy characteristics – a new approach in the inclusive growth literature and a possibly alternative to a single numeric indicator in our models and decision tools.
We expect to be able to report back on this work during Autumn 2021.
The views and opinions expressed in this blog are those of the author/authors.
Links:
- Inclusive Growth Indicators for Cities: considerations and options, Inclusive Growth Analysis Unit Briefing Paper 6 - August 2017
- Lee, N. (2018) Inclusive Growth in cities: A sympathetic critique. Regional Studies, LSE Working paper https://doi.org/10.1080/00343404.2018.1476753
- We need an Inclusive Economy not Inclusive Growth - Policy Provocation - https://cles.org.uk/
- Scotland's First Minister's TED Talk: We should focus on wellbeing, not just GDP - July 2019
First published: 20 August 2021
<< Blog
By Ruth Lupton, Ceri Hughes and Lucy Gavens