

Ethnicity Pay Gap
The University applies demographic categorisation in accordance with the Higher Educational Statistics Agency (HESA) for the purpose of this exercise consistent with HE practice across Scotland. Similarly, we widely apply the acronym BAME (Black, Asian and Minority Ethnic) which we have relied upon throughout our equal and pay gap reporting to denote those social groups who may have been subject to historic and contemporaneous forms of racism and exclusion.
It is recognised that such aggregate forms of conceptualisation are not ideal and may mask important differences between groups. It should be noted however that lower levels of colleague disclosure on ethnicity prohibit further breakdown into separate ethnic groupings.
The ethnicity pay gap is calculated by comparing the average and median salary of colleagues categorised as BAME with the respective statistical data for those categorised as ‘White’.
Table 6 below shows that the average and median ethnicity pay gaps have widened since 2020. The median ethnicity pay gap is narrow at 2.9% and narrower than the gender pay gap of 8.4% and sits below the sector median gap of 3.8%[1]. It is notable however that the gap has widened by nearly 5 percentage points since 2020 at which time there was a positive variance in favour of BAME colleagues.
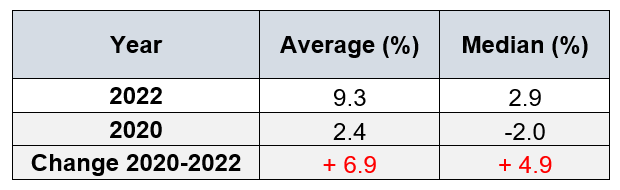
Table 6. UofG Average and Median Ethnicity Pay Gaps 2020- 2022
These data merit further review in the context of occupational segregation coupled with the low level of reporting by colleagues with regards to their ethnicity.
Vertical Occupational Segregation
Figure 4 shows that 19.7% of colleagues have either yet to complete or have chosen not to share their ethnicity information. This is particularly evident across Grades 4-6 where c.25-31% of our colleagues have not disclosed this information. The low level of reporting of ethnicity related information naturally impacts the reliability of our ethnicity pay gap reporting.
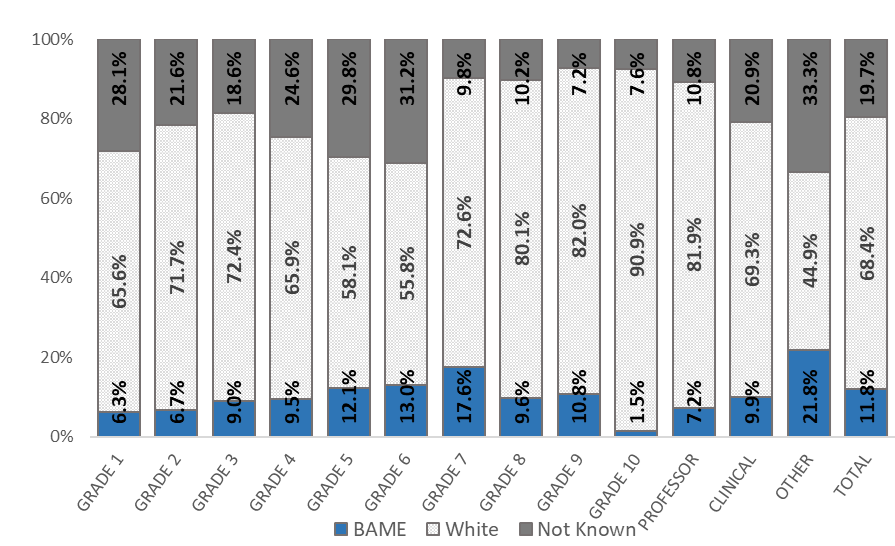
Figure 4. UofG Colleague Population by Grade and Declared Ethnicity Grouping (31 August 2022)
The proportion of colleagues disclosing their ethnicity information grouped as BAME has increased from c.9% in 2020 to c.12% in 2022. This aligns with the University’s KPI to grow the percentage of colleagues within the UK BAME category.
There is greater representation of BAME colleagues at Grade 7 which may be explained by the large population of early career researchers within this grade which directly corresponds to the increasing representation of colleagues from minoritised ethnic groups across our Research population[2].
Horizontal Occupational Segregation
Figure 5 shows the greatest representation of BAME colleagues amongst our R&T job family from which it is difficult to draw clear conclusions about horizontal occupation segregation. This might best be explained by the low levels of disclosure with respect to ethnicity related information for colleagues across all job families, however it is clearly evident that a higher proportion of our staff population employed within the R&T job family have disclosed this information.
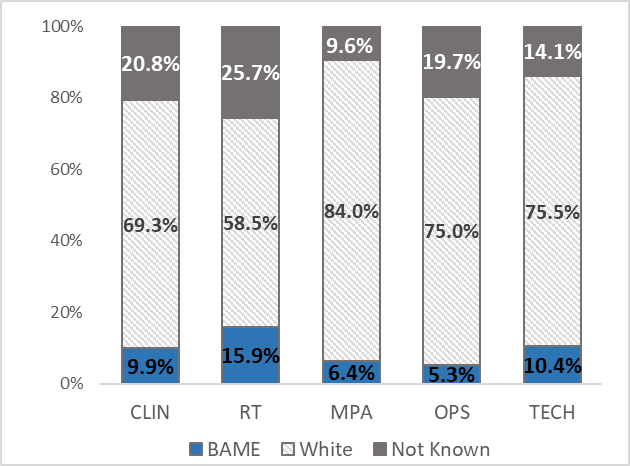
Figure 5. UofG Colleague Population by Job Family and Declared Ethnicity Grouping (31 August 2022)
Figure 6 below highlights the distribution of our BAME and White workforce by job family. This highlights, as previously suggested, that our BAME population are markedly more likely to be engaged in R&T related roles in any comparative analysis with our White workforce, with 72.0% BAME representation compared to 46.0% White.
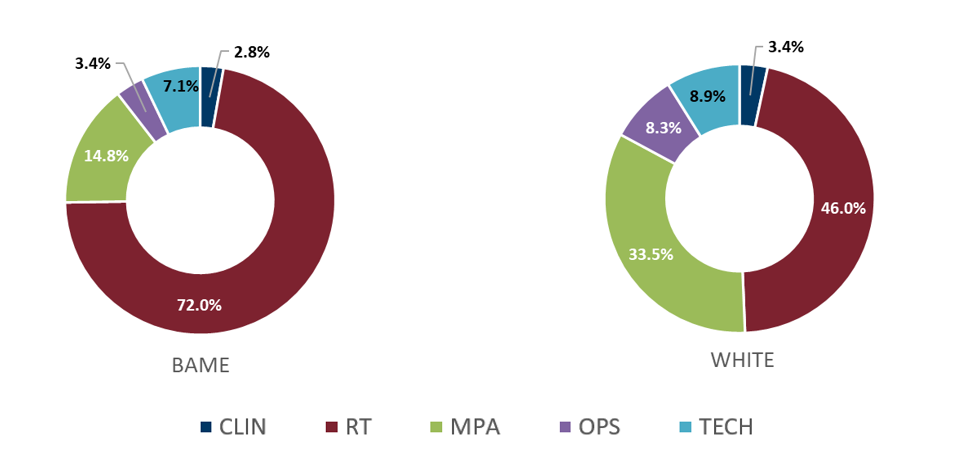
Figure 6. UofG Job Family Distribution Across Each Declared Ethnicity Grouping (31 August 2022)
Equal Pay
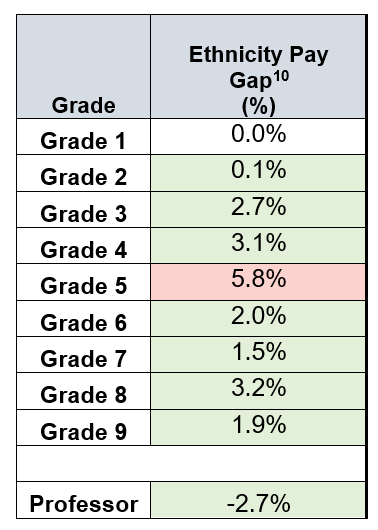
Table 7. Ethnicity Pay Gaps by Grade (31 August 2022)
The ethnicity pay gap across Grades 1-9 and the Professoriate fall within the permitted variance of +/-5% as defined by the EHRC as outlined in Table 7 above, with the exception of Grade 5 where there is a 5.8% gap in favour of White colleagues. It is not possible to provide Professorial Zone and Grade 10 (Professional Services) pay gap data as the level of disclosure is either too small or there is a lack of comparator data.
The validity and reliability of this data set should be considered in the context of a sizeable proportion of colleagues across our grading structure who have not shared their ethnicity information. Further, Figure 4 on p.9 shows that c.30% of colleagues on Grade 5 have not disclosed their ethnicity information which may have an impact on the level of the gap in this case. Work is ongoing in reviewing and re-calibrating the University’s pay structure which offers opportunities to explore the factors that may be influencing the ethnicity pay gap at Grade 5.
The gap has widened at Grade 8 to 3.2% in this analysis representing an increase of 1.4% to that reported in 2020. This corresponds to an increase in BAME colleagues in this grade having joined the institution on a starting salary at the base of the pay scale alongside a decrease in the number of BAME colleagues at the top of this grade.
There has been a slight increase in the ethnicity pay gap amongst the Professoriate in favour of colleagues grouped within the BAME category since last reported in 2020 from -2.3% to -2.7% in this analysis. This corresponds with a 31% increase in levels of disclosure across the Professoriate within the BAME category.
[1] UCEA, 2023. Intersectional Pay Gaps in Higher Education 2020-21
[2] Although all data by Grade here should be reviewed with caution due to the marked gaps in ethnicity reporting.
[3] (-) denotes a pay gap in favour of colleagues grouped within ‘BAME’ category.