

Gender Pay Gap
The University recognises that it is important to tackle the underlying causes of the gender pay gap, as these apply to equality of opportunity, career development and progression. Success in these areas is demonstrable in the increased representation of women across our senior grade cohort in the period since the 2023 published report.
The most recent Academic Promotion round, concluded in the summer of 2024, reported a higher number of successful female applications to professorial level than that of male applications. This is fundamental to our ambition to achieve parity in demographics at this level. Consequently, females now represent 35% of our Professoriate, an increase of 4% from 2022. Additionally, our Senior Management Group is now almost 50% female, an increase of 3% from 2022.
Overall, the University continues to make good progress in reducing our gender pay gap from our position in 2020, (Table 1) while noting a relatively static picture with respect to the average pay gaps and a slight increase in the median pay gap since last reported in 2022.
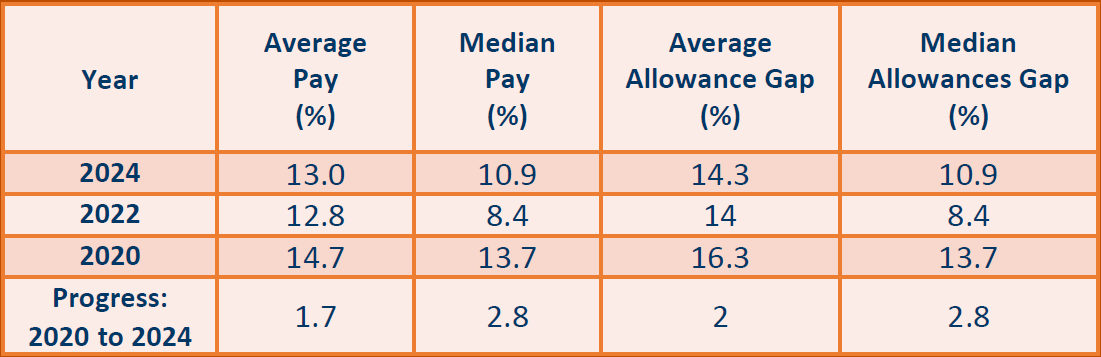
Table 1: UofG Average and Median Gender Pay and Allowance Gaps 2020 - 2024
The increase, most notably in the median, has been driven by our Clinical cohort for whom we are subject to the pay review parameters applied by NHS Scotland which is beyond our control. The University however would observe a reduction in both average and median pay gap data from an average of 12.8% and median of 11.2% in 2022 compared to12.6% and 9.2% respectively in 2024 if we excluded this group from the data set.
The University compares favourably with the Russell Group and the wider HE sector in relation to both average and median pay gaps, and remains committed to tackling pay gaps in every sense.
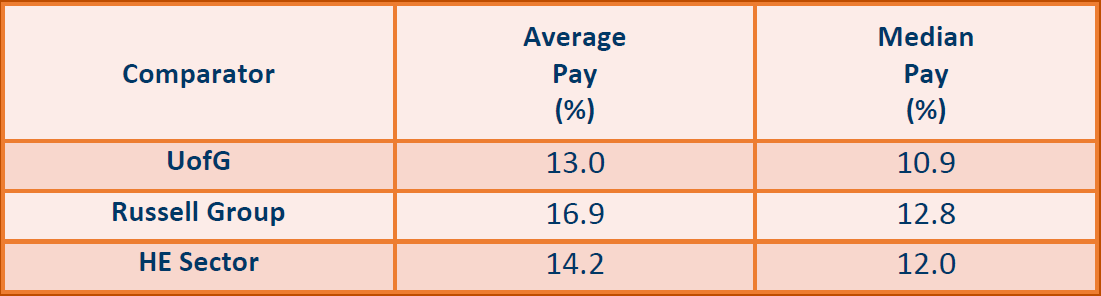
Table 2: UofG Average and Median Gender Pay Gaps with Russell Group & HE Sector [3]
Equal Pay
Average pay gaps within our substantive grades and professorial zones continue to fall within the permitted variance of 0/-5% as defined by EHRC [4] and outlined in Table 3.
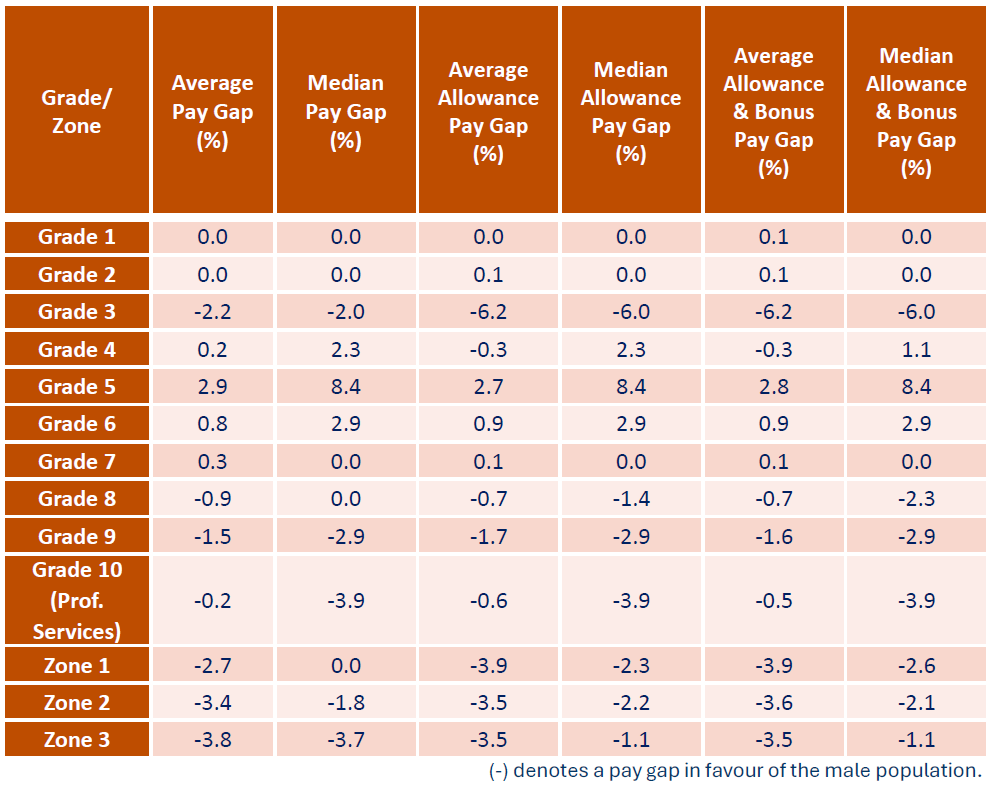
Table 3: Average and Median Equal Pay Gaps by Gender across Graded and Zoned colleagues (September 2024) [5]
The University remains aware of the impact of the demographic spread, and resulting occupational segregation, on pay gaps. This is particularly evident relative to the median pay gap at Grade 5 and the pay gaps applicable to Allowances and Bonuses at Grade 3 level, as evidenced in Table 3 where pay gaps become more significant.
Females continue to make up the largest cohort across Grades 1 to 8 with the trend reversing at more senior levels of Grade 9 and above, with the exception of Grade 3. This is typically referred to as Vertical Segregation where one group is over-represented at specific levels within an organisation, most typically males at senior levels as reflected in Figure 1.
Impact on the University’s pay gaps is further evident across our professorial zones, which continue to be male dominated (Figure 1). Here, we observe a progressive widening of the pay gap compared to those in Grades 1 to 9, as evidenced in Table 3.
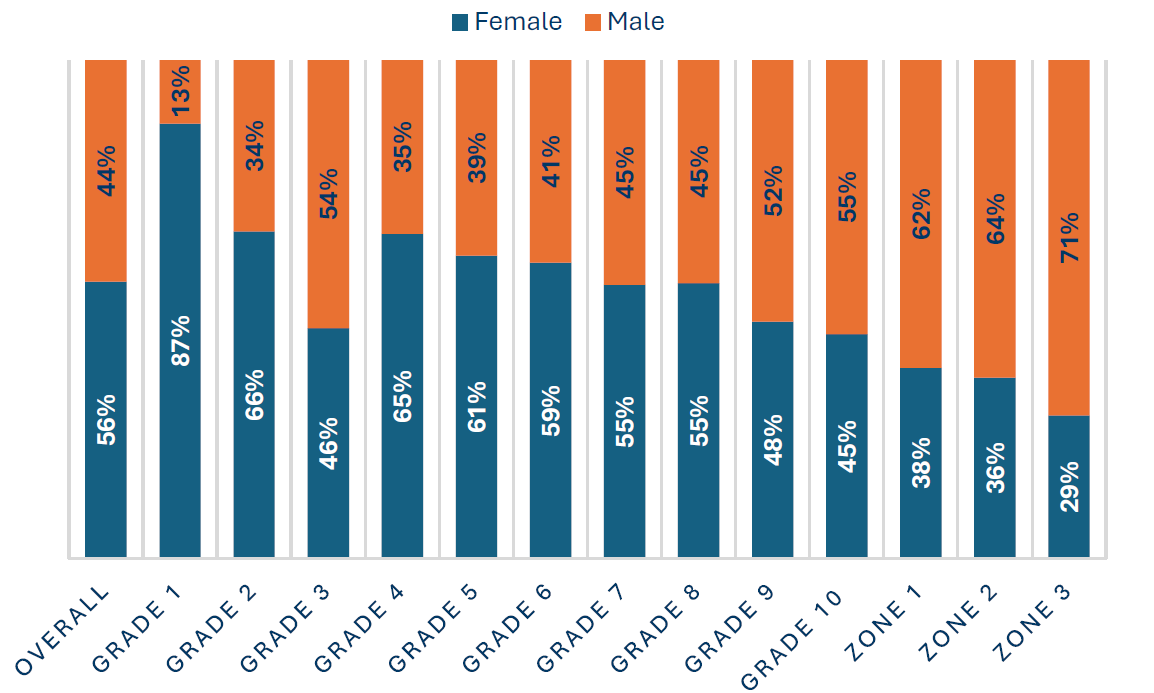
Figure 1: Demographic Spread: Graded and Zoned Staff
Horizontal Segregation occurs when specific roles are typically dominated either by men or women. This is evidenced at both Grade 3 which is male dominated, particularly in roles that attract shift allowances, and at Grade 5 in which females dominate.
The most significant change in our pay gap compared to 2022 is within our Grade 10 cohort. Despite continuing to report a pay gap in favour of males, we observe a substantial decrease from an average pay gap of 11.3% and a median pay gap of 10.5% to 0.2% and 3.9%, respectively, as shown in Table 3.
Clinical Academics and Others
The University employs a relatively small number of colleagues outwith our substantive pay structure. These groups are split into two distinct groups: ‘Clinical’ and ‘Others’ for pay gap reporting purposes.
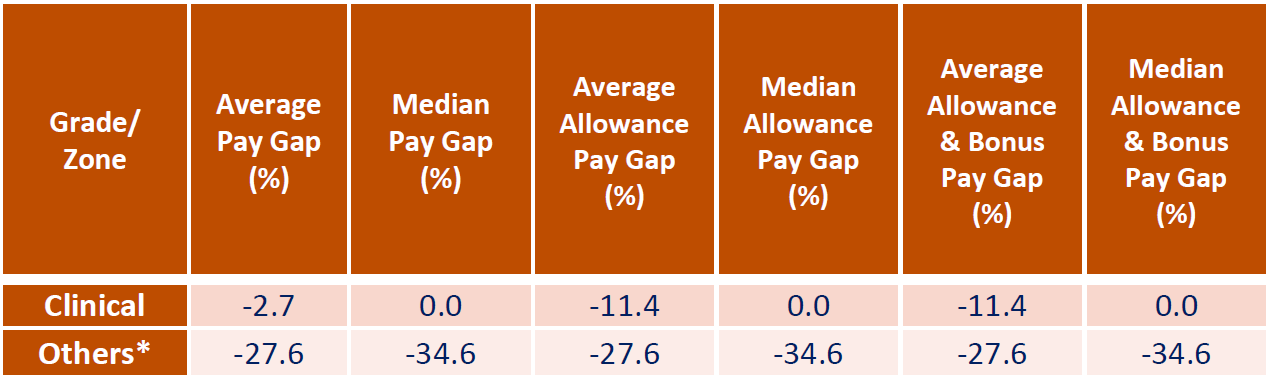
Table 4: Average and Median Equal Pay Gaps by Gender across Uncategorised Colleagues (September 2024)
The remuneration package and structure for those within the Clinical category is dictated by NHS Scotland, which leaves little discretion on the part of the University.
The ‘Other’ category includes those paid through the Medical Research Council (MRC), Marie Curie Fellowship Schemes and others not engaged on UofG pay scales. Further analysis of this cohort is prohibited as it contains several sub-categories which restricts our ability to disaggregate data and/or draw any clear conclusions from any such analysis.
[3] UCEA – Intersectional Pay Gaps in Higher Education 2022-23
[4] In accordance with guidance from the Equality and Human Rights Commission
[5] Due to small numbers and to maintain colleague confidentiality, the University is unable to publicly report on the following groups: Zone 4 Professors, Non-zoned Professors and SMG. The University actively monitors these groups to identify any potential areas of concern.