

Disability Pay Gap
The University applies demographic categorisation in accordance with the requirements of HESA when collecting colleague disability data. Low disclosure rates make it difficult to conduct meaningful pay analysis by disability status. The disability pay gap is calculated by comparing the average and median salary of Disabled colleagues with the respective statistical data for non-Disabled colleagues.
Table 8 below shows that the average and median disability pay gaps have remained relatively static since 2020 and demonstrate substantial pay gaps in favour of non-Disabled colleagues.
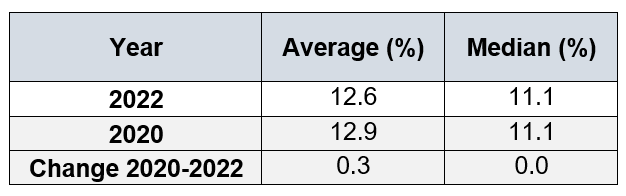
Table 8. Average and Median Disability Pay Gap (31 August 2022)
Vertical Occupational Segregation
Disability pay gap data must be reviewed in the context of the low proportion of Disabled colleagues compared to those who are non-Disabled across the University, coupled with a lack of disability related reporting by 29% of our colleagues as outlined in Table 7 below.
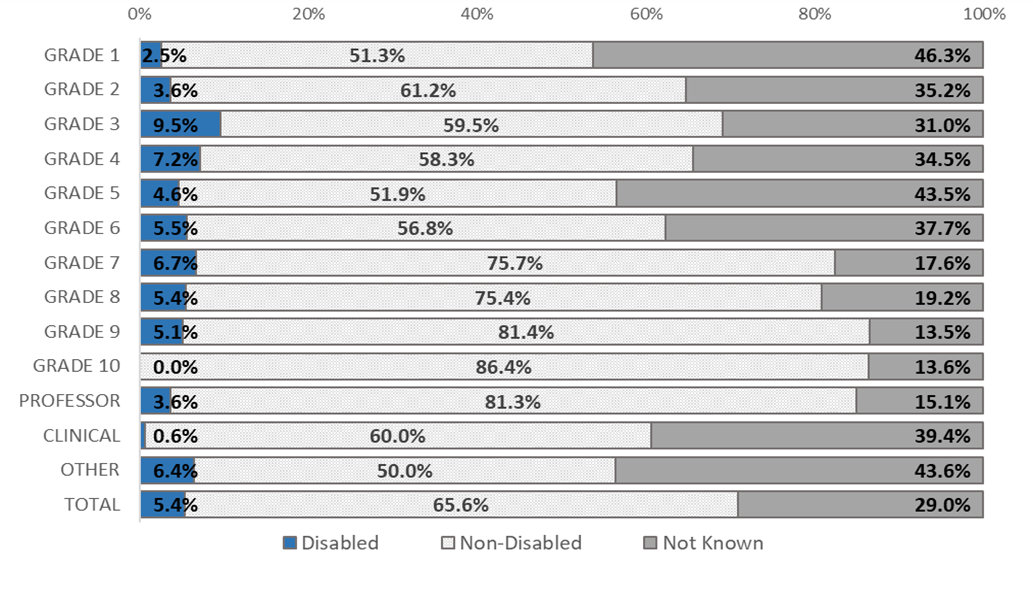
Figure 7. UofG Colleague Population by Grade and Declared Disability Status (31 August 2022)
Horizontal Occupational Segregation
Figure 8 shows the highest representation of Disabled colleagues amongst the MPA job family while Figure 9 suggests Disabled colleagues are most likely to be engaged in roles within the R&T job family than across other job families. That said, a similar pattern is evident with respect to non-disabled colleagues. This may contribute to the low level of disability pay gaps across grade levels as outlined in Table 9 below compared to the overall disability pay gap which is impacted by the low disclosure rate.
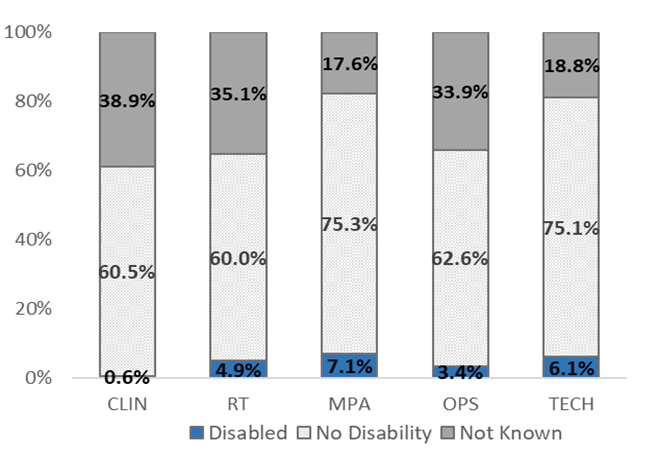
Figure 8. UofG Colleague Population by Job Family and Disability Status (31 August 2022)
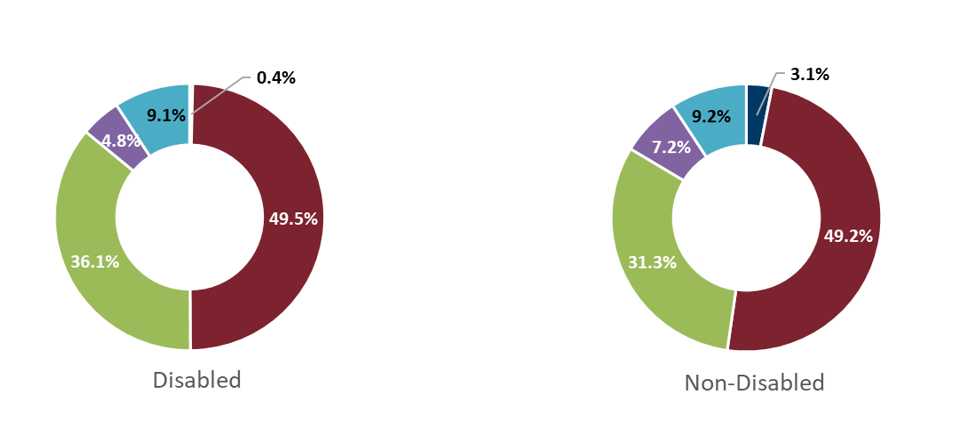
Figure 9. UofG Job Family Distribution across Disabled/Non-disabled Cohorts (31 August 2022)
Equal Pay
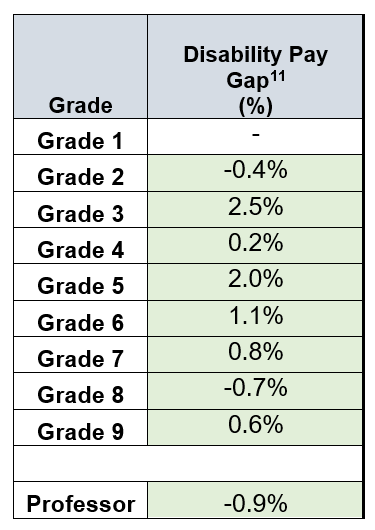
Table 9. Disability Pay Gaps by Grade (31 August 2022)
The disability pay gap across Grades 1-9 and the Professoriate fall within the permitted variance of +/-5% as defined by the EHRC as outlined in Table 9 above. The validity and reliability of this data set should be considered in the context of a sizeable proportion of colleagues across our grading structure who have not disclosed disability related information. It is not possible to provide data for Grades 1, 10 (Professional Services) and Professorial Zones, as the numbers declared are either too small or there is a lack of comparator data.
Disabled colleagues constitute 3.6% of the Professoriate and are paid on average more than their non-disabled counterparts, however, in considering this data set it should be borne in mind that 15.1% of our professorial population have not disclosed their disability status.
[1] (-) denotes a pay gap in favour of Disabled colleagues.