

Operational Rules, Image Manipulation Policy, and Further Information
Image Manipulation Fraud
Image manipulation fraud:
Digital images presented for publication in scientific research papers are carefully checked by editors and reviewers to ensure that they have not been tampered to hide or falsify research results thus demeaning scientific hypothesis value. It is thus important that staff and students understand which type of manipulations should be avoided when processing images for publication.
Guidelines for image manipulation:
1. Keep all original raw unprocessed image files in case you are asked to explain exactly what changes s have been applied to your submitted image files, (i.e. the software and editing tools used to change image properties). Any alterations should be made on a copy of the original. Retaining a copy of the original unchanged image is your optimum defence protection against accusations of image fraud misconduct.
2. When submitting images for publication make sure you know which types of image processing are acceptable and those which are not. Check also the journal rules for submission.
3. Simple adjustments to the entire image are acceptable. Moderately adjusting the brightness, balance, or contrast intensity of an image is permissible but only if the entire image is adjusted equally and each pixel within the matrix of pixels forming the image has been linearly adjusted. Adjustments to brightness and contrast which truncate or over saturate the pixel intensity information are not acceptable. It is essential that no information is obscured or lost when compared to the raw image when the above adjustments are performed. Changes to image gamma which is a non-linear process must be declared in the accompanying figure legend.
4. Cropping an image is usually considered an acceptable form of image manipulation. You should consider if the crop procedure being carried out is legitimate, e.g. does the crop improve the “composition” of the image, is it being used to discard or hide something that is contradictory to your preferred hypothesis. Legitimate reasons for image cropping include positioning an object in the centre of an image, excluding debris and trim removal of “empty” space around image edges. Non legitimate forms of cropping include removing information that changes the context of what remains in the image after it has been cropped, e.g. cropping out dead or dying cells to only display viable healthy cells, crop removal of gel bands that might disagree with the hypothesis being proposed in the paper.
5. Digital images that will be compared with each other should be recorded under identical conditions, and identical post-acquisition image processing should also be applied to each image being compared. Accurate comparison of images recorded from treated and control samples is impossible if the images have not been acquired under identical conditions When images are to be compared to one another, the processing of the individual images should be identical. This includes background subtraction or white-level balancing.
6. Manipulations applied to a specific image area but not to other areas may be questionable. An example of a legitimate use of selective enhancement is a 16-bit greyscale image that has important features situated at both extremes of its dynamic range. To enable readers to see both features, a scientist might decide to selectively enhance the image. If portions of a published image are selectively enhanced it must be declared in the figure legend. Selective enhancement of an image that is not reported would most likely be viewed as research misconduct.
8. Copying or cloning objects into a digital image from other parts of the same image or from a different image is very questionable. Cloning or copying to falsely create or move objects within an image that originally did not exist within the image is research misconduct, (image falsification/fabrication). Examples of misconduct would include copying gel bands into an existing gel image to create a new result, or an image created from the combination of portions of two or more images. Combining two images into a single figure from separate images is fine and must be communicated clearly to the editor and reviewers.
9. Intensity measurements should be performed on uniformly processed image data. Intensity measurements should be performed on unprocessed data or carefully processed data to avoid potential artefacts. If normalisation, flat-field correction or any other image processing has been applied then it should be uniformly performed across all the recorded image data sets, and the processing should be carefully detailed in the methods section of an article. The use of software filter convolution kernels should be considered with caution since the filters may generate unexpected artefact leading to artefact quantification rather than actual data.
10. Avoid the use of lossy compression. JPEG is an ISO/ITU13 standard file format for storing images that uses the discrete cosine transform to compress the file. To save disk hard space, it may be tempting to acquire your image files in lossy compression JPEG format but doing so will compromise your data. It is unsuitable for images of scientific data because the cosine transform applied changes the spatial resolution of the image and the intensity value of any given pixel. Always use TIF format for image analysis.
11. Magnification and Resolution are Important. Scaling of pixels in X, Y and Z must remain unchanged so that image features can be accurately interpreted. The magnification of an image is determined by the difference between the original scale of the pixel and the scale of the pixel in its final form. Since it is impossible to know in advance what the final magnification will be, a scale bar of known size is the best way to display the magnification.
12. Take care when changing the size (in pixels) of a digital image. Enlarging or decreasing the size of an image, (the number of pixels in X and Y), can introduce artifacts. For example, decreasing image size in pixels will reduce its spatial resolution. If the size reduction is not by a power of two, the software program performs an interpolation to create both a new XY resolution and new intensity values for each pixel. Enlarging image size in pixels also causes the software program to interpolate the new XY resolution and pixel-intensity values. When enlarging or reducing an image in size, users should insert a magnification scale bar prior to changing the total number of pixels in an image. Magnification may be nearly impossible to calculate afterwards. Ideally, image size should only be changed once to prevent resizing artifacts from compounding one another.
Automated image forgery detection software:
A new image fraudulent checking software tool was developed in February 2018 which can automatically detect duplicated reused images across thousands of papers even if they have been rotated, resized, or had their contrast and colour changed. This new software will allow editors to screen scientific images before publication more scrupulously, so always retain copies of the original unmanipulated image files.
Retraction Watch Blog Forensic’s Friday series:
Retraction watch are a blog site who flag up fraudulent image manipulations have recently started a “Forensic’s Friday” series where you are presented with images and asked to detect what is odd with them. The board are committed to educating authors on best practises in publishing, figure preparation and reproducibility. Please see this Web link.
Examples of image forgery manipulation:
One of the controversial fraudulent images which set twitter into a frenzy is presented in Figure 1, faked paper can be accessed from the following web link
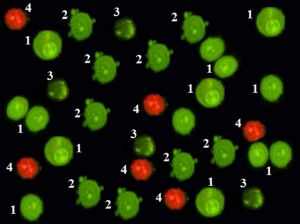
Figure 1: Doctored image presented in Figure 6 from Scientific Reports:
Every cell in each stage of cell death (1 = viable cells; 2 = cell membrane blebbing, 3 = chromatin condensation, 4 = late apotopsis) is an exact duplicate.
Other falsely manipulated images presented in the published paper are as follows:
Figure 2: Falsified image presented in Figure 1 from Scientific Reports:
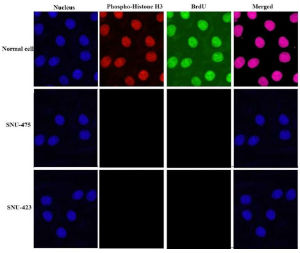
SNU-423 nuclei have been copied from the normal cell and is a
vertical and horizontal mirror of it. The nuclei in SNU-475 is a copy crop portion taken from the normal cell.
Figure 3: Falsified image presented in Figure 4 from Scientific Reports:
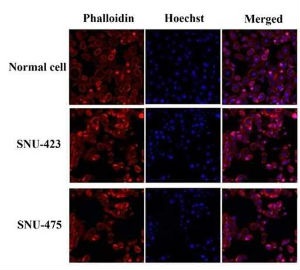
Images representing the SNU-423 and SNU-475 cell lines are copies of one another which have been differently digitally transformed, (look at the similar cells shapes and positions).
Useful Imaging Software Tools and Databases
University of Glasgow drop off service
A data file transfer service is available on campus for transferring large image data set files up to 20.0 GB. Use the data file transfer service.
Free software for analysing and processing image data
- ZEN LITE for windows: Free software to analyse and open .czi files. Download of the software can be accessed here.
- Carl Zeiss Image Browser: This browser is an ideal tool for general image archiving, handling and interactive measurement. Features include orthogonal sectioning, 3D cut function, 3D view with calculation of single projections, interactive measurement functions in the overlay dialog, such as scale bar, distance and area. Contact john.pediani@glasgow.ac.uk who can send the software direct to you.
- LAS X Core: Free software from Leica to open images acquired on the Leica SP8 confocal or any microscope controlled by LAS X. Windows OS only supported. Software can be downloaded here.
- Fiji: ImageJ plus a large bundle of plugins, all packaged together in one easy-to-download application. Runs on Mac OS, Windows, and Linux. Great for new users who don't want to download individual plugins. Includes utilities for 3D viewing, video editing, measuring colocalization among others. Web link: https://imagej.net/software/fiji/downloads
- ICY: Open community platform with software resources to visualise, annotate and quantify bioimaging data. Web link: ICY.
- VLC: VLC media player is a free and cross-platform multimedia player that plays most multimedia files as well as DVDs, Audio CDs, VCDs, and varios streaming protocols. Web link: VLC Player.
- CellProfiler: Free, open-source software from the Broad Institute for segmentation and quantitative analysis of microscope image data. Web link: CellProfiler.
- Ilastik: Free software that uses machine learning for interactive object recognition and segmentation. Web link: Ilastik.
Fluorescent Dye Spectrum Viewers
Spectrum dye viewers are valuable tools for determining the best wavelength of light to use to excite your dye along with the optimal wavelength range to record the emitted fluorescence. From the spectrum dye plots you can also quickly establish if cross excitation and dye bleed through will be an issue.
- Thermofisher Fluorescence Spectrum Viewer
- SearchLight from Semrock (a manufacturer of optical filters).
- Chroma Spectra Viewer (manufacturer of optical filters).
- Omega Curvomatic Optical Spectra Viewer (manufacturer of optical filters)
- Arizona University Spectral viewer
- Fluorophore Org Spectra Viewer
Fluorescent Protein Databases
Fpbase: is a free and open-source, community-editable database for fluorescent proteins (FPs) and their properties. FPbase has a variety of tools to:
- Explore the lineage and directed evolution of FPs.
- View relationships between FP properties
- Compare spectra with common filters and light sources
- Calculate FRET relationships
- Create and share curated protein collections
- Build a spectra viewer customised for the specifications on your microscope
Web link: Fpbase database.
OsFP: web server for predicting the oligomeric state of fluorescent proteins. Web link: OsFP database.
Alphafold 3 Protein Structure Database
Alphafold 3 is an Artificial Intelligence (AI) open-source database system developed by Google Deepmind that predicts a protein's 3D structure from it's amino acid sequence. It is free to use for non-commercial research and can be used to model interactions between structures composed of: proteins, DNA, RNA, ligands, ions and chemical modifiers. Simple Google sign up and the acceptance of non-commercial use terms can be accessed here.
Operation Rules
All users must be trained by facility staff to use the microscope(s).
Using the microscopes:
Always book microscope time using the appropriate online calender website (Clustermarket: https://app.clustermarket.com/login or BookMyLab: BookMyLab
You will be charged only for the time used, but please try and be considerate to others and not book excessive time. Maximum time available will be 3 hr slots unless unused slots are free after you have finished.
DO NOT USE ANOTHER USERS LOG IN DETAILS !
Please start your session punctually (on evenings and weekends as well as regular hours). The billing starts automatically from the start of your session.
If you finish more than 30 min early, please update your end-time on the booking calendar so others can observe microscope time is available, or contact the next user, as you think is most appropriate.
All arc lamps must be kept on for 30 min minimum and need to cool down for 30 min before re-ignition.
Turn each microscope on and off as you have been instructed, don't turn on components you will not use (e.g. 633 nm laser when only imaging eGFP with the 488 nm laser line).
Clean any oil objectives you have used only with the lens tissue and lens cleaner provided. Ensure you leave the microscope clean for the next user.
If you bring any live specimens, please dispose of them in your lab. No potentially harmful samples can be imaged.
Check the online booking calendar at the end of your session; leave the system on if someone is booked next (within 1hr for laser scanning confocals or other scopes), otherwise turn it off. Keep lasers in standby whenever possible to prolong their life.
Report any problems with the instrumentation to facility staff responsible for instrumentation. Do not try to fix it yourself. Also do not install any software on to the computer. If there is an emergency outwith hours switch off the instrumentation immediately and contact facility staff detailing the problems you encountered.
Mercury Lamp Safety:
Mercury lamp can only be re-ignited after 30 min of switching off. After the ignition, please leave it on for more than 30 min.
Users should not attempt to change or align the mercury lamps on the microscopes.
If a mercury lamp is misaligned or not igniting, please contact facility staff.
In the rare case of a mercury lamp explosion, a limited but significant amount of mercury vapour can be released. All personnel must follow the following rules:
1. Avoid inhaling any mercury vapour and leave the room immediately, closing the door behind you to isolate the room. You should put a notice on the door advising others not to enter due to the safety hazard.
2. If users have suffered from ‘arc-eye’ caused by the flash of explosion (UV exposure) they must be escorted to Occupational Health (OH) or out of hours to Accident & Emergency. N.B. Symptoms may develop hours after exposure. OH must always check suspect eye injuries.
3. The area must not be re-entered for a minimum of 30 minutes to allow dispersal of the mercury. After this time the lamp housing will have cooled and it will be safe to remove the mercury using a special adsorptive agent.
Cancelling Policy:
If you need to cancel your booking, please delete your reserved time on the booking calendar as far ahead as possible.
If you fail to cancel your reservation and don't use the machine, a charge will still be made for your entire reserved time.
You are responsible for your data:
Any image files left on the computer hard-drives are unsafe and may be deleted without warning. Transfer your data to a safe location as soon as possible after acquisition.
Please don't leave behind copies of your files because the servers/computers quickly get over-loaded by the volume of image files produced.
It is useful to store a reference file (e.g. to reload settings) so it is okay to permanently retain a small volume of data in a clearly marked folder.
VR Microscopy Software (free software).
ExMicroVR (version 2.5) software can be utilised to view multi-channel confocal fluorescence microscope image stacks in immersive Virtual Reality and is free to use for non-profit academic research groups. The software is compatible with workstation based VR systems, like Oculus Rift-S, Oculus Quest in Link Mode, HTC Vive, and Microsoft Mixed Reality (WMR) systems like Samsung Odyssey.
The software plus instructions how to use it can be downloaded from the web link below:
https://www.immsci.com/exmicrovr-license/
You will need to install SteamVR software on to a VR compatible work station computer as it is required to run the ExMicroVR software.
You will have to create a Steam.com user account to download Steam VR and SteamVR should be installed prior to installing the ExMicro VR software.
Test confocal fluorescence images are also available for VR viewing.
Once you have installed Steam VR you can run a Steam Performance test to establish if your computer/RAM video graphics card can render high quality VR.
Features of the ExMicro VR Software are listed below:
- Use ImageJ to prepare image files in NIfTI format
- Load up to 30 channels of 3D image stacks
- Connect and work with other researchers online anywhere in the world
- Adjust image settings (brightness, threshold, etc.) for each channel individually
- Grab image and manipulate for fast identification of regions of interest
- Measure physical distance between points in the image
- Compute and display voxel intensity histograms
- Compute Blend functions between pairs of channels
- Create, Modify, and Save new channels
- Use “Excluder” objects to hide, or focus on, key image regions
- Mark and count key image objects (e.g. vacuoles)
- Display multi-channel image-stacks as short 30 frame movies
- User Excluder to explore and select the best 2D view for publications
- Compatible with NVIDIA 1070 and above class VR workstations (not cell phones)
Professor Craig Daly has used the software and a VR head set to overcome the limitations of viewing 3D/4D images on a 2D desktop screen, (ConfocalVR Craig Daly VR Microscopy Immersive Visualization - YouTube).
VR allows you to freely navigate into your 3D imaging data set from any angle or position and observe important relationships between structures within your 3D image with a depth perception equivalent to the real world which is impossible to perceive on a desktop screen system.
Watch a video of the VR headset in action.
View a summary of the diverse range of biological 3D imaging data sets Craig has generated.