Interactive Map - SIPHER Inclusive Economy Dataset (local authority level)
Quick Guide
- Select the indicators of interest from a top dropdown tab
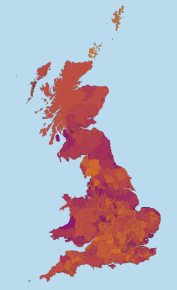
- Explore the presented map of Great Britain to reveal detailed insights for each local authority.
- A side panel confirms full details of the selected indicator.
- Zoom in or pan across the map to easily locate areas of interest.
- Hover over any local authority, and a pop-up box will confirm the local authority name along with its corresponding indicator score, providing instant clarity and context.
- Adjust the year bar below the map to select the desired year. Data can be viewed across a 5 year period (2017 - 2021) allowing dynamic shifts to be highlighted.
Please direct questions or feedback marked "IE Interactive Map" to sipher@glasgow.ac.uk
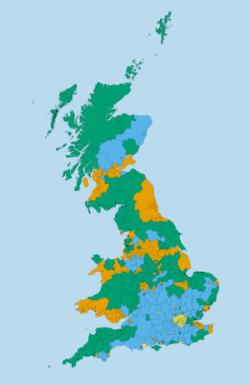
One of the key features of this dataset visualisation is the ability to cluster local authorities based on their level of economic inclusion.
Select Clustering from the drop down to present a Four-cluster k-means solution for 2020.