

Carbon Reduction Plans
The carbon footprint for 2022/23 reporting year is yet to be determined. The extent to which we have used our CHP engine to generate both heat and electricity, combined with rebounding post-pandemic travel-related emissions make predicting the 2022/23 footprint very difficult. As such, we have assumed a worst-case scenario for 2022/23, in which emissions rebound back to 2018/19 levels; this will be updated in version 1.3 of the plan in 2024.
3.1 Gas and Electricity Consumption
Decarbonising the supply of heat to our complex estate in the coming years will be very challenging. We are currently investigating a range of options to meet our future heat demand.
The national electricity grid is expected to further decarbonise in coming years. Current grid carbon intensity is 0.19 kgCO2e/kWh and this is projected to fall to 0.09 kgCO2e/kWh by 2030. Thus, we expect to see a 53% reduction in Scope 2 carbon emissions reduction by 2030, which equates to a net carbon saving of 5,263 tCO2e.
The range of planned energy efficiency interventions and investments in renewable energy technologies across the estate, along with the estimated carbon savings are summarised in Table 2, below.
|
Action |
23/24 |
24/25 |
25/26 |
26/27 |
27/28 |
28/29 |
29/30 |
Total savings (tonne CO2e) |
|
National Grid Decarbonisation |
-752 |
-752 |
-752 |
-752 |
-752 |
-752 |
-752 |
-5263 |
|
Solar PV |
-5 |
-5 |
-227 |
-209 |
-42 |
|
|
-488 |
|
LED installation and controls |
-255 |
-300 |
-300 |
-300 |
-200 |
-150 |
-100 |
-1605 |
|
Low carbon heat |
|
|
|
|
-4,963 |
-1,389 |
-5,658 |
-12,010 |
|
Heat & Ventilation optimisation |
-37 |
-42 |
-34 |
-19 |
-19 |
-14 |
-19 |
-184 |
|
Fabric improvements |
-29 |
-21 |
-31 |
-21 |
-31 |
-31 |
-36 |
-200 |
|
Life cycle replacement |
-80 |
-50 |
-50 |
-50 |
-50 |
-50 |
-50 |
-380 |
|
Annual carbon savings (tCO2e) |
-1,158 |
-1,170 |
-1,394 |
-1,351 |
-6,057 |
-2,386 |
-6,615 |
-20130 |
Table 2 – Energy efficiency and renewable energy emissions savings to 2030
For deployment of solar PV systems, an assessment of suitable space across the estate will be performed. Consideration will also be given to the potential for ground-mounted solar PV arrays.
With respect to energy efficiency, there are a range of current and planned building-level LED upgrade projects that will be delivered in collaboration with our property maintenance partner, CBRE. In addition, improvements to our Building Management Systems (BMS) and the outputs from our various Digital Twin projects should allow us to realise significant emissions savings from adjustments to heating/ventilation controls. Fabric improvements, such as glazing replacements, draught proofing and roof/wall thermal insulation upgrades will also help us to realise emissions savings and will be continuously delivered, along with heat recovery projects, as part of our ongoing asset management programme. Lastly, our ongoing asset life cycle replacement programme will be underpinned by a sustainable design approach involving the following steps:
- Verification that system is required.
- Accurate design and equipment sizing performed to reflect the needs.
- Consideration given to other non-energy demanding solutions.
- High energy efficiency specification equipment selected.
- Good quality installation and maintenance plan developed.
In conclusion, our current emissions in relation to energy consumption are 26,920 tCO2e. Successful project delivery within the above-identified areas should deliver total carbon emissions savings of 20,130 tCO2e by 2030.
3.2 Sustainable Laboratories
As a research-intensive institution, UofG operates a large numbers of laboratories (989 at the time of writing), which are amongst the most energy intensive spaces on the estate and take up a total of 41,865m2 (7.8% of total space).
Until recently there has been no co-ordinated attempt to ensure that these spaces are run in an efficient and sustainable manner. As a result, practices varied widely across the campus, sustainability of the operations was often not considered, and there was significant room for improvement. Recruitment of a full-time Sustainable Laboratories Co-ordinator has brought about a considerable improvement in awareness, alignment to the Laboratory Efficiency Assessment Framework (LEAF) programme and enabled identification of a range of carbon reduction programmes as set out in Table 3, below.
|
Action |
2023/24 reduction (tCO2e) |
2024/25 reduction (tCO2e) |
2025/26 reduction (tCO2e) |
2026/27 reduction (tCO2e) |
Total reduction (tCO2e) |
|
Ultra Low Temperature Freezer Replacement |
-10 |
-20 |
-20 |
|
-50 |
|
Fume Cabinet Recommissioning and Refurbishment |
-100 |
-200 |
-150 |
-150 |
-600 |
|
Rollout of LEAF |
-200 |
-400 |
-600 |
-250 |
-1,450 |
|
Annual carbon savings (tCO2e) |
-310 |
-620 |
-770 |
|
-2,100 |
Table 3 – Identified interventions for sustainable laboratories to 2030
A programme of fume hood/cold storage/technical equipment replacement, in combination with operational efficiency savings driven via staff engagement with the Laboratory Efficiency Assessment Framework (LEAF) will enable us to realise additional emissions savings of 2,100 tonne CO2e per annum in the coming decade.
3.3 Commuting Emissions
We estimate that there is significant potential to reduce the carbon emissions associated with staff and student commuting over the coming decade.
For this to be achieved, leadership, partnership working, and behavioural change will be required to support sustainable travel modes. Many of the infrastructure improvements required to improve sustainable travel are out with the campus and are the responsibility of external organisations, such as the City Council. Individual level behavioural change is also needed to drive modal shifts, however changing peoples’ behaviour is challenging, can take time to take effect and is often reliant on having the correct infrastructure, policies, and incentives in place.
Our analysis has shown that if staff continue to work from home for two days per week, and students studied from home for an extra day each week (compared to the base year), savings of 4,000 tonne of CO2e per annum could be realised from avoidance of commuting. Set against this saving, we estimate that emissions of 2,700 tonne CO2e would be generated from the additional requirement to heat domestic residences during the daytime. Thus, we believe that the net carbon saving would be 1,300 tonne CO2e, per annum.
In addition, we estimate a further emissions savings of 1,000 tonne CO2e from increased adoption of electric vehicles for commuting travel.
Table 4 below, details a list of the priority actions that need to be taken, if we are to encourage beneficial modal shifts and achieve the required emissions reductions from commuting travel.
|
Action |
2023/24 reduction (tCO2e) |
2024/25 reduction (tCO2e) |
2025/26 reduction (tCO2e) |
2026/27 reduction (tCO2e) |
2027/28 reduction (tCO2e) |
2028/29 reduction (tCO2e) |
2029/30 reduction (tCO2e) |
Total reduction (tCO2e) |
|
Maintain Hybrid working |
-1300 |
|
|
|
|
|
|
-1,300 |
|
Increase electric vehicles for commuting |
|
|
|
-100 |
-200 |
-300 |
-400 |
-1,000 |
|
Improvement plan for active travel |
|
|
|
|
|
-100 |
-100 |
--200 |
|
Improve public transport |
|
-40 |
-40 |
-40 |
-40 |
-40 |
-40 |
-240 |
|
Extend bike hire |
|
-40 |
-40 |
-40 |
-40 |
-40 |
|
-200 |
|
Promote sustainable travel |
-40 |
-40 |
-40 |
-40 |
-40 |
|
|
-200 |
|
Improve bicycle facilities |
-250 |
-250 |
|
|
|
|
|
-500 |
|
Other active travel |
-100 |
-100 |
-100 |
-100 |
-100 |
-100 |
-50 |
-650 |
|
Annual carbon savings (tCO2e) |
|
|
|
|
|
|
|
-4290 |
Table 4 – Priority interventions for reducing carbon emissions associated with staff/student commuting
If the University continues with transport modal shifts, then we will deliver emissions savings of ~4290 tonne CO2e per annum by 2030.
3.4 Business Travel Emissions
During the academic year 2018/19, business travel by university staff accounted for 13,194 tonne CO2e, with the vast majority of this attributable to air travel. We need to reduce this amount by ~55% by 2030.
UofG has recently published detailed guidance for business-related travel, which highlights the need to significantly reduce the carbon impact associated with this source of emissions, however adherence is not currently mandatory.
It is uncertain how quicky levels of business travel will return to 2018/19 levels, post-pandemic, however a steady increase in demand is expected in the mid-term (2025-2030). We have already seen a significant rebound in business travel-related emissions during the 2021/22 academic year. Additional policies and interventions will be required to suppress this increase in demand such as the continued use of software to facilitate online meetings. These will include removing the option of air travel for trips within the UK and setting firm targets for business travel at School level (including the requirement to pay for offsets where Schools exceed targets).
Table 5 below, details a list of the priority actions that need to be taken, if we are to achieve the reductions in business travel emissions described above.
|
Action |
2023/24 reduction (tCO2e) |
2024/25 reduction (tCO2e) |
2025/26 reduction (tCO2e) |
2026/27 reduction (tCO2e) |
2027/28 reduction (tCO2e) |
2028/29 reduction (tCO2e) |
2029/30 reduction (tCO2e) |
Total reduction (tCO2e) |
|
Set annual School business travel targets |
-1222 |
-1107 |
-1003 |
-910 |
-824 |
-747 |
-677 |
-6500 |
|
Remove option for UK air travel |
|
-800 |
-500 |
-500 |
|
|
|
-1800 |
|
Campus Travel Plan |
-20 |
-20 |
-20 |
-10 |
-10 |
-5 |
-5 |
-90 |
|
Annual carbon savings (tCO2e) |
|
|
|
|
|
|
|
-8390 |
Table 5 – Priority interventions for reducing carbon emissions associated with business travel
If we undertake these measures to reduce business travel, then we will deliver emissions savings of 8,390 tonne CO2e by 2030.
3.5 Waste Management
In addition to facilitating more efficient servicing of our buildings, the rollout of improved internal recycling across the estate could deliver in the region of 160 tonne CO2e in emissions savings per annum by 2030.
The success of the UofG WARPit asset reuse portal should also be noted. Since its launch 7 years ago, we have been able to divert around 170 tonne of surplus furniture from landfill, accounting for around 75 tonne CO2e in emissions savings per annum. We estimate that a re-launch of the portal, with a wider focus (i.e. not just furniture reuse) could help to realise a further 3 tonne CO2e, in emissions saving per annum.
A summary of planned waste management interventions can be found in Table 6, below.
|
Action |
2023/24 reduction (tCO2e) |
2024/25 reduction (tCO2e) |
2025/26 reduction (tCO2e) |
2026/27 reduction (tCO2e) |
Total reduction (tCO2e) |
|
Improved internal recycling facilities |
-160 |
|
|
|
-160 |
|
Deposit Return Scheme |
|
-1 |
|
|
-1 |
|
Polystyrene recycling facilities |
|
-1.5 |
|
|
-1.5 |
|
Recycling laboratory waste |
|
|
-1.5 |
|
-1.5 |
|
Improved recycling facilities |
|
|
-4 |
|
-4 |
|
Relaunch of WARPit |
-3 |
|
|
|
-3 |
|
Annual carbon savings (tCO2e) |
-163 |
-2.5 |
-5.5 |
0 |
-171 |
Table 6 – Identified waste management interventions to 2030
In total, we believe we will be able to realise carbon emissions savings of ~170 tonne CO2e per annum, relating to improved waste management processes by 2030.
3.6 Information Technology
The Saughfield Centre, created in 2020 to centralise and update university servers has delivered a welcome improvement in the quality of data provision on campus. However, Information Services still host server rooms in both the James Watt North and Boyd Orr Buildings that are hugely inefficient when compared to modern standards. Information Services have recently made progress in identifying a power-efficient server hosting facility (best-in-class PUE of 1.18) to complement the Saughfield Centre and plan to migrate their on-campus servers to a 3rd party co-location site over the latter-half of 2023. This will result in all Information Services computer and storage workloads being hosted in energy efficient facilities, and emissions savings of ~ 270 tonne CO2e p.a. to the University.
The identified service provider also has capacity to host additional workloads, including those processing sensitive data. Thus, there is potential for Colleges and Schools, who control 31 other largely inefficient server rooms across the campus, to decant to the co-location facility.
Work is now underway to begin metering these College and School server rooms, to better understand current operating costs and any emissions savings that might be achieved by improving efficiency in the future.
Other ways identified by Information Services to reduce energy consumption and associated emissions by ~100 tonne CO2e p.a. are as follows:
- Introducing more modern ways of working – moving to laptops / docking stations, reducing the widespread use of multiple devices and enabling home working without infrastructure on campus – the Modern Desktop programme has progressed significantly to provide all staff with a laptop device and move away from desktop class machines.
- Network Investment Programme - this has retired the first core networking hardware in favour of modern more efficient units.
- Upgrading campus printing devices to more modern equipment.
Currently, IT-related efficiency savings should deliver ~370 tonne CO2e p.a. by 2030. Further detailed work will be required to understand the potential for emissions reductions, associated with the improved management of College/School run server rooms.
3.7 Space Utilisation
The University estate currently comprises 71,032m2 of office space, supporting a staff complement of 6,934 FTE. Based on 100% allocation per FTE, this equates to an average of 10.2m2 per person.
We anticipate that increased agile working over the next decade (on average, 2 days per week working from home @ 60% allocation), will reduce our requirement for staff office space to 42,432 m2.
However, current growth projections for both PGR students and staff over the next decade will require us to provide an additional 17,400m2 of office space (again assuming that both groups will also work from home 2 days per week) over the period.
Therefore, by 2030, we anticipate that our requirement for office space on the estate will be reduced by around 11,000m2, equating to a carbon saving of ~1,000 tonne CO2e per annum.
3.8 Property Divestment
The UofG estate has a diverse mix of buildings, some of which are less energy efficient than others. A programme of divesting from buildings that have the worst performance from an energy perspective, could also help us to deliver carbon emissions reductions.
The projected disposal of buildings by 2030 will reduce our carbon emissions by ~500 tonne CO2e per annum.
3.9 New Build, Refurbishment & Asset Maintenance
The University has a set of Design Standards which help to ensure that our new buildings, refurbishments and asset maintenance activities are delivered to the highest achievable standards by setting out guidance on space standards, maintenance and access, servicing & deliveries, estates & operations, security, ICT, fire, sustainability, inclusive design, grounds & landscaping, signage and business continuity. These standards are live documents and are regularly updated to reflect developments in best practice.
Whilst the Design Standards are key policy for the University, the setting of project specific targets at project inception is key to driving sustainability into future projects. By setting targets early project teams have the greatest influence on successful implementation, since as a project progresses the cost of change is likely to increase. Targets will be set on a project-by-project basis with the Sustainability Design Guardian, a party independent of the design team, responsible for setting these at challenging levels relative to the project scope. As an example, current targets for new labs build target a 50% reduction in embodied carbon (from 1400kgCO2/m2 to 700kgCO2/m2) and a 60% reduction in operational energy (from 600kWh/m2/annum to 250kWh/m2/annum).
A Measurement and Verification (M&V) process will be utilised throughout a project’s design, construction, and in-use stages, to document the setting, monitoring, and evaluation of the project’s sustainability in line with the agreed Key Performance Indicators (KPIs). M&V will be carried out by the appropriate members of the project team and monitored by the Sustainability Design Guardian.
It is important that targets are set proportionally to the scale and scope of the project to reduce unnecessary use of resources and the risk of increasing project cost. The targets set for any project are under the umbrella of Key Performance Indicators which reflect some of the aspirations and principles of the UN Sustainable Development Goals and the RIBA Sustainable Outcomes. These KPIs encompass the goals as set out within the University Design Standards.
Soft Landings is a process that recognises the ongoing maintenance/operational costs of a building during its lifecycle far outweigh the original capital cost and carbon impact of construction. Application of and adherence to the soft landings processes should ensure that in-use performance of the buildings is optimised, through early engagement with both building managers and end users in the design process and by learning from previous experience, to reduce cost and carbon impact.
Implementation of the above processes should help to minimise the impact of our evolving estate but will not in every case deliver emissions reductions, particularly where additional space is created.
3.10 Carbon Accounting
The Governance and Policy section of our Climate Change Strategy requires that reports to Court, its subcommittees and Senior Management Group need to consider the sustainability impact of activities, policies and inventions.
The carbon impact of our future strategic and investment decisions must be quantified and then accounted for in any future projections of our carbon footprint. This will be implemented in 2023/24.
3.11 Summary
To conclude with, Table 7 below summarises the carbon emissions savings that we can expect to achieve, from each of the different interventions described previously.
|
Intervention |
Emissions savings achievable by 2030 (tonne CO2e) |
|
Gas & Electric |
20,130 |
|
Sustainable Laboratories |
2,100 |
|
Commuting |
4,290 |
|
Business Travel |
8,390 |
|
Waste Management |
171 |
|
Space utilisation |
1,000 |
|
Property divestment |
500 |
|
IT infrastructure |
370 |
|
|
|
|
Total savings to 2030 (tonne CO2e) |
c 37,000 |
|
New build emissions to 2030 (tonne CO2e) |
715 |
|
Remaining emissions in 2030 (tonne CO2e) |
c 24,000 |
Table 7 – potential carbon emissions savings by intervention, to 2030
Not all these interventions will be straightforward to deliver, and each comes with its own set of challenges with respect to implementation.
Table 8 below, summarises the level of difficulty associated with the various interventions described in this carbon management plan, using red, amber and green signifiers. Broadly speaking, the wider strategic alignment of the proposed interventions is strong. Conversely, cultural readiness for change may be somewhat weaker.
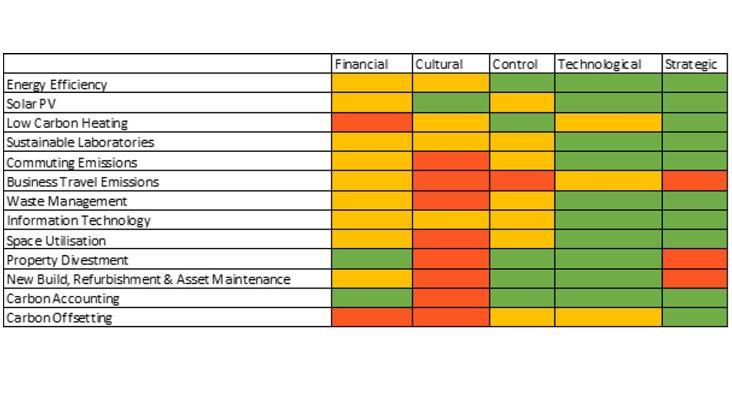
Table 8 – Ease of implementation for interventions described in this Carbon Management Plan
Figure 3 below, projects what our carbon footprint might look like in 2029/30, if we were successful in implementing all of the changes that have been described in this section of the Carbon Management Plan.
It must be repeated that the carbon footprint for 2022/23 reporting year is yet to be determined. The extent to which we have used our CHP engine to generate both heat and electricity, combined with rebounding post-pandemic travel-related emissions make predicting the 2022/23 footprint very difficult. As such, we have assumed a worst-case scenario for 2022/23, in which emissions rebound back to 2018/19 levels; this will be updated in version 1.3 of the plan in 2024.
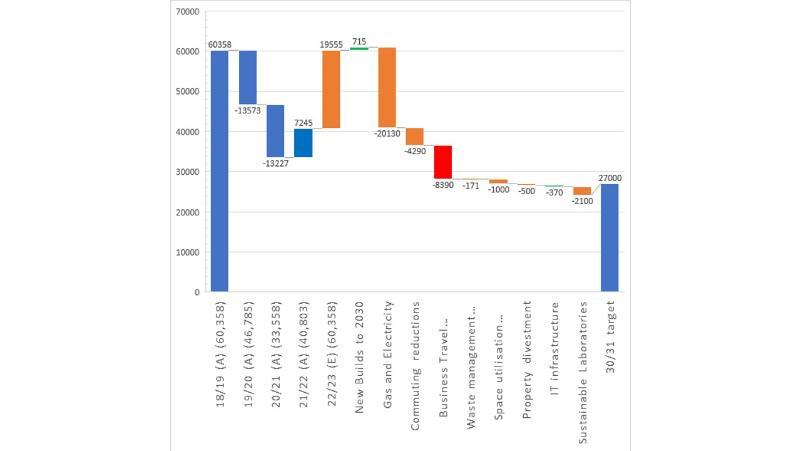
Figure 3 – Pathway to University of Glasgow 29/30 carbon footprint target
The projected outtake position in 2029/30 is 24,000 tonne CO2e and is below our current target of 27,000 tonne CO2e, per annum. However, it is recognised that given the cultural factors outlined in table 8 that achievement remains challenging.
3.12 Concluding remarks
Delivery of this CMP will be monitored by the Sustainability Working Group over the course of 2023/24 and progress will be reported back to both University Court and Scottish Government. We commit to updating the CMP on an annual basis.