

Annex 2: Technical Annex and supplementary information
A2.1 Cancer sciences in Glasgow
As outlined in Section 2.2, there is a wide range of key life sciences infrastructure assets within Glasgow that are fundamental to the work of both the School of Cancer Sciences and the CRUK Scotland Institute. Examples of such infrastructure are provided in Table 6, which highlight Glasgow’s strengths in cancer sciences, precision medicine, tissue sampling, advanced imaging, clinical trials and omics.
Table 6: Key life sciences infrastructure in Glasgow
|
Name |
Summary |
Location |
|
Genomics Innovation Alliance |
Building on the successes of past genomics innovation partnerships (e.g. Glasgow Precision Oncology Laboratory), the Genomics Innovation Alliance (GIA) is a partnership between the University of Glasgow and NHS Greater Glasgow and Clyde (NHSGGC) that capitalises on existing expertise, leadership and clinical infrastructure to enable the development and clinical and economic evaluation of potential new genomics innovations. Piloted in Glasgow, underpinned by the Lighthouse Lab/Living Laboratory infrastructure with University and NHS working together, GIA offers the opportunity develop a national platform for diagnostics and the application of Precision Medicine, as a key building block of Scotland’s life sciences ecosystem. GIA delivers a platform that will underpin a co-creation model to drive translation and implementation of genomics innovations to improve healthcare outcomes, deliver efficiencies for the NHS and foster innovation. By working in partnership with NHSGGC molecular diagnostics laboratory GIA offers a co-development environment where industry and academics can access resources integrated with NHS systems to validate and evaluate potential genomic diagnostics. GIA provides a framework under which potential genomic innovations are assessed for suitability and readiness for adoption into the NHS, including consideration of potential barriers such as integration into existing NHS platforms and workforce implications. This model will support the delivery of Scotland’s genomic ambitions, smoothing the pathway for testing and translation and enabling ready implementation into NHS workflows to enable sustainable delivery for the NHS. |
Queen Elizabeth University Hospital |
|
Glasgow Tissue Research Facility (GTRF) |
The GTRF facilitates the collection of and access to tissues collected from consenting patients participating in clinical trials or studies. The GTRF offers a wide range of services, including digital pathology, image analysis, Tissue Microarray construction, and histology services. These services help to bridge the gap for tissue-based research between the NHS, the University of Glasgow, and industry. For example, GTRF has played an important role in the continued development of the I’s renowned in vivo models by helping to transform researchers’ access to human tissues. |
Queen Elizabeth University Hospital |
|
Imaging Centre of Excellence (ICE) |
ICE is a facility that hosts world-leading imaging clinical research facilities, which provide a nexus for academic, NHS and industrial expertise into advanced imaging. It is home to the 7 Tesla (7T) MRI scanner, an ultra-high-resolution scanner which was the first of its kind to be fully integrated within a clinical site in the UK underpinned by world-leading clinical expertise in stroke, cardiovascular disease and brain imaging. |
Queen Elizabeth University Hospital |
|
Precision Medicine Living Laboratory |
The Precision Medicine Living Laboratory is the result of a £38 million award by the UKRI Strength in Places Fund in 2020, designed to build on Glasgow's existing leadership and infrastructure in precision medicine and cement the region’s status as a world leader in this field. Through the development of cutting-edge tools and innovations such as medical imaging, genomics, and artificial intelligence, precision medicine can be used to help treat people quickly and more successfully whilst avoiding unnecessary side effects from ineffective treatments. |
Queen Elizabeth University Hospital |
|
Glasgow Molecular Pathology Node27(Medical Research Council/ Engineering and Physicl Sciences Research Council) |
The Glasgow Molecular Pathology Node was a partnership between the University of Glasgow, the NHS, and industry to create a multi-disciplinary centre of excellence in the research and development of molecular diagnostic tests for cancer and other chronic diseases. |
Queen Elizabeth University Hospital |
|
Industrial Centre for Artificial Intelligence Research in Digital Diagnostics (iCAIRD)28 |
iCAIRD was a world-class centre of excellence focusing on the application of AI to digital diagnostics. As with much of the region’s other life sciences infrastructure, it helped facilitate collaboration between research-active clinicians and innovative SMEs to better inform clinical questions and ultimately solve healthcare challenges more quickly and efficiently. iCAIRD promoted two distinct eco-systems for AI development - one focused on the needs of AI in radiology, and the other on AI in pathology. |
Queen Elizabeth University Hospital |
|
Beatson West of Scotland Cancer Centre |
The Beatson West of Scotland Cancer Centre is an internationally renowned cancer centre and the busiest in the UK in terms of clinical activity and patient numbers. It is also the second largest cancer centre in the UK, delivering all radiotherapy and much of the chemotherapy to the population of the West of Scotland, with a catchment area that accounts for roughly two-thirds of Scotland’s population. |
Gartnavel General Hospital |
|
Glasgow Clinical Trials Unit |
The Glasgow Clinical Trials Unit (GCTU) supports all aspects of clinical trial research from concept through to analysis & reporting. The GCTU is established within the University of Glasgow and Greater Glasgow & Clyde Health Board, with specialist services provided by the Robertson Centre for Biostatistics, Glasgow Clinical Research Facility and Greater Glasgow & Clyde NHS R&I. |
Gartnavel General Hospital |
|
West of Scotland PET/CT Centre |
The West of Scotland PET/CT Centre is a purpose-built facility with space for 2 PET/CT systems, a cyclotron and associated laboratory facilities. It serves as one of two bases in Glasgow from which the Translational Molecular Imaging (TMI) centre, which is operated by the CRUK Scotland Institute, operates. TMI advances novel imaging technologies and is as a shared resource for the CRUK Scotland Institute and Cancer Research UK Scotland Centre researchers. |
Gartnavel General Hospital |
|
Name |
Summary |
Location |
|
Experimental Cancer Medicine Centre (ECMC) Glasgow |
The Glasgow ECMC is a partnership between the University of Glasgow, the CRUK Scotland Institute, NHS Greater Glasgow and Clyde, and the Beatson West of Scotland Cancer Centre. The Glasgow ECMC forms part of a network of 17 ECMC adult centres, including one in Edinburgh, and 12 ECMC paediatric centres across the UK. ECMCs work in conjunction with local NHS facilities to provide access to cutting-edge trials and treatments to help find new ways to detect, monitor and treat the disease to help beat cancer sooner. In January 2023, it was announced that Glasgow’s adult and paediatric ECMCs will receive up to £2.2 million to help doctors and scientists develop the cancer treatments of the future. The Glasgow ECMC has also been designated as a CRUK Biomarker of Excellence – one of four in the UK – with researchers from the ECMC working in partnership with Cancer Research UK’s Centre for Drug Development on translational biomarker research for early-stage clinical trials. |
University of Glasgow Garscube Campus |
|
Glasgow Polyomics |
Glasgow Polyomics brings together world-renowned experts in the field of omics research, with a focus on genomics, transcriptomics, proteomics, metabolomics and lipidomics, bioinformatics and data analysis. Glasgow Polyomics aims to understand the molecular processes of health and disease, facilitating and developing cutting-edge research across biology. Its expertise has been utilised in clinical projects, industrial biotechnology, drug discovery, and biomarker identification. |
University of Glasgow Garscube Campus |
|
Scottish Centre for Macromolecular Imaging |
The Scottish Centre for Macromolecular Imaging (SCMI) was established in September 2018 to provide support to researchers across Scotland for cryo-electron microscopy of a wide range of scientific samples. As well as offering advanced instrumentation, the centre is staffed by experienced personnel who provide support and advice in the areas of sample optimisation, preparation and screening of cryo-grids and high-resolution data collection. SCMI is funded by the Medical Research Council, the universities of Glasgow, Edinburgh, Dundee and St Andrews, Scottish Funding Council, Scottish Universities Life Science Alliance, CRUK Scotland Institute and MJM Smith Trust. |
University of Glasgow Garscube Campus |
A2.2 The impact of the CRUK Scotland Institute’s and the School of Cancer Sciences’ expenditures
In Section 3, we outlined our analysis of the direct, indirect, and induced impacts associated with the operational and capital expenditures of the CRUK Scotland Institute and the School of Cancer Sciences. These impacts can be measured in terms of economic output, gross value added, and (full-time equivalent) employment. The following provides further methodological detail on how we arrived at the estimates.
A2.2.1 Direct impact of the institutions’ expenditures
To measure the direct economic impact of the purchases of goods, services, and labour by the CRUK Scotland Institute and the School of Cancer Sciences, we used information ontheir operational expenditures (including staff and non-staff spending), capital expenditures, and the number of staff employed (in FTE), in 2021-2229.
In terms of monetary economic output (measured in terms of expenditure), the direct economic impact associated with the CRUK Scotland Institute’s and the School of Cancer Sciences’ expenditures stood at approximately £50 million in 2021-22 (see Figure 8). This includes £29 million of staff costs, £20 million of other (non-staff) operating expenses30, and £0.5 million of capital expenditure incurred in that year.
Figure 8: Direct economic impact (in terms of output) of the CRUK Scotland Institute and the School of Cancer Sciences expenditure in 2021-22, by type of expenditure
| Staff costs | £28.9m |
| Non-staff costs | £20.2m |
| Capital expenditure | £0.5m |
| Total | £49.6m |
Note: We exclude a total of £0.4 million of non-staff costs associated with depreciation, and £1.6 million of staff costs associated with movements in pension provisions, as it is assumed that these are not relevant from a procurement perspective (i.e., these costs are not accounted for as income by other organisations). All estimates are presented in 2021-22 prices and rounded to the nearest £0.1m.
Source: London Economics’ analysis based on data provided by the University of Glasgow.
A2.2.2 Indirect and induced impacts of the institutions’ expenditures
The assessment of the indirect and induced economic impacts associated with the expenditures of the CRUK Scotland Institute and the School of Cancer Sciences were estimated using economic multipliers derived from Input-Output tables, which measure the total production output of each industry in the UK economy, and the inter-industry (and intra-industry) flows of goods and services consumed and produced by each sector. In other words, these tables capture the degree to which different sectors within the UK economy are connected, i.e., the extent to which changes in the demand for the output of any one sector impact on all other sectors of the economy. To be able to achieve a breakdown of the analysis by region, we developed a multi-regional Input-Output model, combining UK-level Input-Output tables (for 201631) with a range of regional-level data32 to achieve a granular breakdown by sector33 and region34.
Using this Input-Output model to derive economic multipliers by sector and region35, we then applied the estimated multipliers as follows:
To estimate the impact of the expenditures incurred by the CRUK Scotland Institute, we applied the estimated average multiplier associated with organisations in the Scottish professional and support activities sector; and,
To estimate the impact of the SCS’s expenditures, we applied the estimated average multiplier associated with organisations in Scotland’s government, health, and education sector.36
The multipliers are expressed in terms of economic output, gross value added, and (full-time equivalent) employment, and are calculated as total multipliers, capturing the aggregate impact on all industries in the UK economy arising from an initial injection relative to that initial injection.
The resulting multipliers are presented in Table 7 (for Scotland and the UK as a whole37), indicating that:
- Every £1 million of operational or capital expenditure incurred by the CRUK Scotland Institute generates an additional £1.19 million of impact throughout the UK economy, of which £0.63 million is accrued in Scotland. In terms of employment, we assume that, for every 1,000 (FTE) staff employed directly by the CRUK Scotland Institute, an additional 720 staff are supported throughout the UK, of which 400 are located in Scotland; and
- Every £1 million of operational or capital expenditure incurred by the School of Cancer Sciences generates an additional £1.54 million of impact throughout the UK economy, of which £0.83 million is generated in Scotland. In terms of employment, we assume that, for every 1,000 (FTE) staff employed directly by theSchool of Cancer Sciences, an additional 1,020 staff are supported throughout the UK, of which 560 are located in Scotland.
Table 7: Economic multipliers associated with the expenditures of the CRUK Scotland Institute and the School of Cancer Sciences
|
Institution |
Location of impact | Output | GVA | FTE employment |
| CRUK Scotland Institute | Scotland | 63 | 59 | 40 |
| Total UK | 19 | 06 | 72 | |
| School of Cancer Sciences | Scotland | 83 | 81 | 56 |
| Total UK | 54 | 46 | 02 |
Note: All multipliers constitute Type II multipliers, defined as [Direct + indirect + induced impact]/[Direct impact].
Multipliers for the CRUK Scotland Institute are based on the average multipliers associated with organisations in Scotland’s professional and support activities sector, and multipliers for the School of Cancer Sciences are based on the average multipliers associated with organisations in Scotland’s government, health, and education sector.
Source: London Economics’ analysis
A2.2.3 Adjustments for double-counting and transfers
Before arriving at the total direct, indirect, and induced impact associated with the CRUK Scotland Institute’s and the School of Cancer Sciences’ institutional spending, it is necessary to deduct two income and expenditure items to avoid double-counting, and to take account of the ‘netting out’ of the costs and benefits associated with the Institute’s and the SCS’s activities between different agents in the UK economy. Specifically, we deducted:
- The total research income received by the CRUK Scotland Institute and School of Cancer Sciences in 2021-22 (£40 million), to avoid double-counting with the estimated impact of the institutions’ research activities (see Section 4); and
- £0.1 million in fee waivers and other bursary spending for UK domiciled students provided by the SCS38, as this was included (as a benefit) in the analysis of the Institute’s and SCS’s teaching and learning activities (see Section 5).
A2.2.4 Aggregate impact of the institutions’ spending
Figure 9 presents the estimated total direct, indirect, and induced impacts associated with the expenditures incurred by the CRUK Scotland Institute and the School of Cancer Sciences in 2021-22 (after the above-described adjustments have been made), in economic output, GVA, and FTE employment terms, disaggregated by region. Figure 10 presents the corresponding results broken down by sector.
Figure 9: Total economic impact associated with the CRUK Scotland Institute’s and the School of Cancer Sciences’ expenditure in 2021-22, by region,
output
| North East | £1m |
| North West | £3m |
| Yorkshire & the Humber | £2m |
| East Midlands | £2m |
| West Midlands | £2m |
| East of England | £2m |
| London | £3m |
| South East | £2m |
| South West | £2m |
| Wales | £1m |
| Scotland | £56m |
| Northern Ireland | £1m |
| Total | £77m |
GVA
| North East | £1m |
| North West | £2m |
| Yorkshire & the Humber | £1m |
| East Midlands | £1m |
| West Midlands | £1m |
| East of England | £1m |
| London | £2m |
| South East | £1m |
| South West | £1m |
| Wales | £1m |
| Scotland | £37m |
| Northern Ireland | £1m |
| Total | £49m |
FTE employment
| North East | 10 |
| North West | 15 |
| Yorkshire & the Humber | 10 |
| East Midlands | 10 |
| West Midlands | 10 |
| East of England | 10 |
| London | 10 |
| South East | 10 |
| South West | 10 |
| Wales | 10 |
| Scotland | 445 |
| Northern Ireland | 10 |
| Total | 560 |
Note: Monetary estimates are presented in 2021-22 prices, rounded to the nearest £1 million, and may not add up precisely to the totals indicated. Employment estimates are rounded to the nearest 5, and again may not add up precisely to the totals indicated.
Source: London Economics’ analysis
Figure 10: Total economic impact associated with the CRUK Scotland Institute’s and the School of Cancer Sciences’ expenditure in 2021-22, by sector
Output
| Agriculture | £0m |
| Production | £9m |
| Construction | £2m |
| Distr., transport, hotels & restaurants | £10m |
| Information & communication | £2m |
| Financial & insurance | £3m |
| Real estate | £6m |
| Professional & support activities | £20m |
| Government, health & education | £22m |
| Other services | £2m |
| Total | £77m |
GVA
| Agriculture | £0m |
| Production | £4m |
| Construction | £1m |
| Distr., transport, hotels & restaurants | £6m |
| Information & communication | £1m |
| Financial & insurance | £2m |
| Real estate | £6m |
| Professional & support activities | £11m |
| Government, health & education | £17m |
| Other services | £1m |
| Total | £49m |
FTE empolyment
| Agriculture | 5 |
| Production | 25 |
| Construction | 5 |
| Distr., transport, hotels & restaurants | 85 |
| Information & communication | 10 |
| Financial & insurance | 10 |
| Real estate | 5 |
| Professional & support activities | 220 |
| Government, health & education | 175 |
| Other services | 15 |
| Total | 560 |
Note: Monetary estimates are presented in 2021-22 prices, rounded to the nearest £1 million, and may not add up precisely to the totals indicated. Employment estimates are rounded to the nearest 5, and again may not add up precisely to the totals indicated.
Source: London Economics’ analysis
A2.2.5 Industry breakdown
Table 8 provides an overview of the high-level industry classifications used throughout the multi-regional Input-Output analysis (described in greater detail in Annex A2.2.2).
Table 8: Industry grouping used as part of the multi-regional Input-Output analysis
| Industries included in original UK Input-Output table | High-level industry group [and UK SIC Codes] |
| Crop and animal production, hunting and related service activities | Agriculture [1-3] |
| Forestry and logging | |
| Fishing and aquaculture | |
| Mining and quarrying | Production [5-39] |
| Manufacture of food products, beverages, and tobacco products | |
| Manufacture of textiles, wearing apparel and leather products | |
| Manufacture of wood and of products of wood and cork, except furniture; manufacture of articles of straw and plaiting materials | |
| Manufacture of paper and paper products | |
| Printing and reproduction of recorded media | |
| Manufacture of coke and refined petroleum products | |
| Manufacture of chemicals and chemical products | |
| Manufacture of basic pharmaceutical products and pharmaceutical preparations | |
| Manufacture of rubber and plastic products | |
| Manufacture of other non-metallic mineral products | |
| Manufacture of basic metals | |
| Manufacture of fabricated metal products, except machinery and equipment | |
| Manufacture of computer, electronic and optical products | |
| Manufacture of electrical equipment | |
| Manufacture of machinery and equipment n.e.c. | |
| Manufacture of motor vehicles, trailers and semi-trailers | |
| Manufacture of other transport equipment | |
| Manufacture of furniture; other manufacturing | |
| Repair and installation of machinery and equipment | |
| Electricity, gas, steam, and air conditioning supply | |
| Water collection, treatment and supply | |
| Sewerage; waste collection, treatment, and disposal activities; materials recovery; remediation activities and other waste management services | |
| Construction | Construction [41-43] |
| Wholesale and retail trade and repair of motor vehicles and motorcycles | Distribution, transport, hotels, and restaurants [45-56] |
| Wholesale trade, except of motor vehicles and motorcycles | |
| Retail trade, except of motor vehicles and motorcycles | |
| Land transport and transport via pipelines | |
| Water transport | |
| Air transport | |
| Warehousing and support activities for transportation | |
| Postal and courier activities | |
| Accommodation and food service activities | |
| Publishing activities | Information and communication [58-63] |
| Motion picture, video and television programme production, sound recording and music publishing activities; programming and broadcasting activities | |
| Telecommunications | |
| Computer programming, consultancy and related activities; information service activities | |
| Financial service activities, except insurance and pension funding | Financial and insurance [64-66] |
| Insurance, reinsurance and pension funding, except compulsory social security | |
| Activities auxiliary to financial services and insurance activities | |
| Real estate activities excluding imputed rents | Real estate [68.1-2-68.3] |
| Imputed rents of owner-occupied dwellings | |
| Legal and accounting activities; activities of head offices; management consultancy activities | Professional and support activities [69.1-82] |
| Architectural and engineering activities; technical testing and analysis | |
| Scientific research and development | |
| Advertising and market research | |
| Other professional, scientific, and technical activities; veterinary activities | |
| Rental and leasing activities | |
| Employment activities | |
| Travel agency, tour operator reservation service and related activities | |
| Security and investigation activities; services to buildings and landscape activities; office administrative, office support and other business support activities | |
| Public administration and defence; compulsory social security | Government, health & education [84-88] |
| Education | |
| Human health activities | |
|
Social work activities |
|
| Creative, arts and entertainment activities; libraries, archives, museums, and other cultural activities; gambling and betting activities | Other services (90-97) |
| Sports activities and amusement and recreation activities | |
| Activities of membership organisations | |
| Repair of computers and personal and household goods | |
| Other personal service activities | |
| Activities of households as employers; undifferentiated goods- and services-producing activities of households for own use |
Note: ‘n.e.c.’ = not elsewhere classified Source: London Economics’ analysis, based on Office for National Statistics (2023b) and UK SIC Codes (see Office for National Statistics, 2022d)
A2.3 The impact of the CRUK Scotland Institute’s and the School of Cancer Sciences’ research
In Section 4, we outlined our analysis of the economic impact of the CRUK Scotland Institute’s and School of Cancer Sciences’ research activities, including:
- The direct effects of this research (captured by the research income accrued by the institutions, net of any public funding);
- The impact of this research on improved health outcomes (measured in terms of net QALY benefits); and
- The economic impact associated with privately funded research that is crowded in as a result of the publicly (and charity) funded research undertaken by the CRUK Scotland and the SCS.
A2.3.1 Direct research impact
To estimate the direct impact generated by the CRUK Scotland Institute’s and School of Cancer Sciences’ research activities, we used information on the total research-related income accrued by the institutions in 2021-2239, including:
- Income from research grants and contracts provided by UK sources (including the UK Research Councils; UK-based charities; central government bodies, Local Authorities, and health and hospital authorities; industry and commerce; and other UK sources) and overseas (EU and non-EU) sources; and
- Recurrent research funding allocated to the School of Cancer Sciences by the Scottish Funding Council.
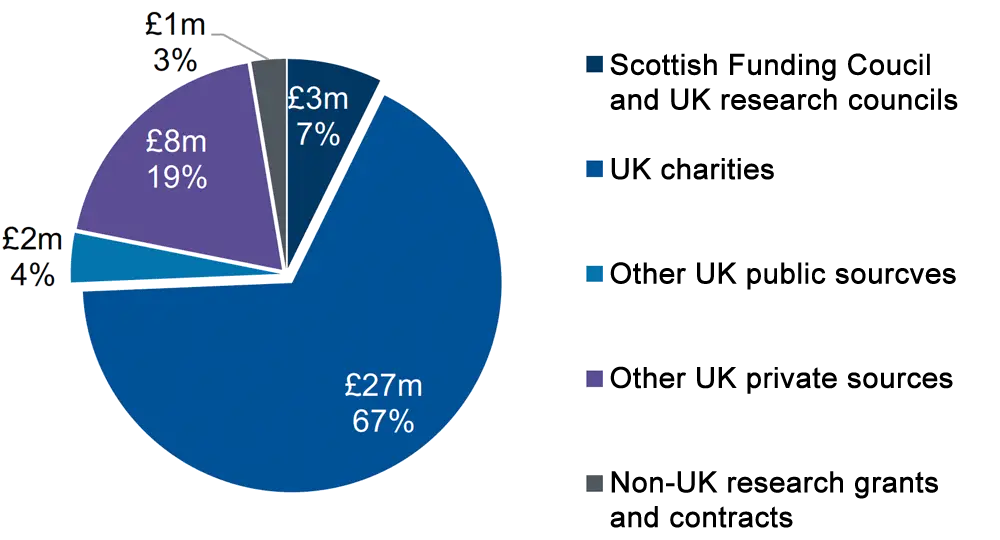
Aggregating across these sources, the combined total research-related income accrued by the CRUK Scotland Institute and the SCS in 2021-22 stood at £40 million (see Figure 11). The majority of this income (£27 million, 67%) originated from UK charities (predominantly Cancer Research UK), with an additional £3 million (7%) received from the Scottish Funding Council and UK Research Councils, £2 million (4%) from other UK public sources40, and £8 million (19%) from other UK private sources (e.g., pharmaceutical companies). In addition, £1 million (3%) of the institutions’ research-related income was derived from non-UK research grants and contracts.
To arrive at the net direct impact of the institutions’ research activities on the UK economy, we deducted the costs to the public purse of funding their research activities in 2021-22 from the above total research income. These public costs include funding from the Scottish Funding Council and UK Research Councils (£3 million) and research income from other UK public sources (£2 million, from UK central government bodies, Local Authorities, and health and hospital authorities). Deducting these total public purse costs (£5 million) from the above total research-related income (£40 million), we estimate that the net direct impact associated with the CRUK Scotland Institute’s and SCS’s research activity in 2021-22 stood at £35 million.
Figure 11: Research income received by the CRUK Scotland Institute and the School of Cancer Sciences in 2021-22, £m by source
Note: All values are presented in 2021-22 prices, rounded to the nearest £1 million, and may not add up precisely to the totals indicated.
Source: London Economics’ analysis based on data provided by the University of Glasgow
A2.3.2 Net QALY benefit
In addition to the direct impact of research, the wider academic literature indicates that investments in cancer research lead to improved patient outcomes through both improved treatment and prevention. These benefits can be quantified by estimating the impact on QALYs, which measure the additional life years gained from cancer research, adjusted for health-related quality of life.41 This value places a monetary benefit on the wellbeing derived from improved quality and duration of life (rather than quantifying labour market benefits such as increased earnings from a longer life duration).42
To measure the QALY patient benefit, we relied on estimates derived from a core study by Glover et al. (2014) on the returns to UK publicly funded and charity funded cancer-related research in terms of the net value of improved health outcomes. The study assesses the net QALY benefit in the UK of UK publicly funded and charity funded cancer-related research conducted between 1976 and 1995, net of the public NHS treatment costs of delivering the improved health outcomes. The study assumes that it takes 15 years before cancer research impacts patient outcomes and that the impact of the research then lasts for 20 years, and estimates an internal rate of return (IRR) associated with public and charity funded cancer research of 10%. Based on the study’s results, we converted this IRR into a monetary multiplier of 8.78, which indicates that every £1 million of UK publicly funded or charity funded cancer research results in £8.78 million of future net QALY benefit to the UK in present value terms.43
To estimate the net QALY benefit associated with the CRUK Scotland Institute’s and School of Cancer Sciences’ research activities, we apply this multiplier to the approximately £31 million of UK publicly funded and charity funded research income received by the Institute and the SCS in 2021-22 (again see Figure 11).44 We thus estimate that the research conducted by the CRUK Scotland Institute and School of Cancer Sciences in 2021-22 will result in a future net QALY benefit to patients of £273 million.45
A2.3.3 Impact of crowded-in privately funded research
Alongside the net QALY benefits of publicly funded and charity funded cancer research, another strand of academic literature suggests that publicly funded and charity funded expenditure in research and development (R&D) also ‘crowds in’ additional private sector research funding. In other words, public and charity research funding encourages private funders to invest in additional research (e.g., to further develop and commercialise the initial fundamental R&D that was undertaken).
We have quantified the economic impact of this crowding-in of privately funded research using estimates from Sussex et al. (2016), who found that, in the UK, a 1% increase in government and charity funded biomedical and health R&D expenditure is associated with a 0.81% increase in private sector pharmaceutical R&D spending. This elasticity figure was converted to a monetary multiplier using data on total UK R&D expenditure by funding source (see Office for National Statistics, 2022c). The resulting estimated multiplier of 1.52 indicates that every £1 million of UK publicly funded or charity funded cancer research results in an additional £1.52 million of privately funded cancer research.46
As with the above-discussed net QALY benefits (see Section A2.3.2), we apply this multiplier to the £31 million of UK publicly funded and charity funded research income received by the CRUK Scotland Institute and the School of Cancer Sciences in 2021-22. Hence, we estimate that the CRUK Scotland Institute’s and the School of Cancer Sciences’ publicly funded and charity funded research crowds in £47 million of subsequent additional privately funded cancer research throughout the UK. To avoid double-counting47, we then deduct the £9 million of private research income48 received by the Institute and the SCS themselves, thus arriving at an estimated £39 million of external private sector research that is ‘crowded in’ as a result of the institutions’ research.49
As with the expenditures of the CRUK Scotland Institute and the SCS, this crowded-in research activity is expected to generate indirect and induced economic impacts throughout the UK economy. In this instance, these additional knock-on effects were estimated by applying the relevant economic multiplier associated with the economic activities of the UK’s scientific R&D sector as a whole (estimated at 2.56).50 Applying this multiplier to the estimated £39 million of external privately funded crowded-in cancer research as a result of the activities of the Institute and the SCS, we estimate that the direct, indirect and induced economic impact associated with this crowded-in R&D stands at £99 million.
A2.4 The impact of teaching and learning activities
As a final core strand of economic impact associated with the activities of the CRUK Scotland Institute and the SCS, we estimate the impact of the institutions’ teaching and learning activities. Specifically, we estimate the net benefits to students/graduates and the Exchequer associated with postgraduate research students (i.e. Doctorate degree students) who are taught at the Institute and the SCS.51 Using the same methodological approach that was applied to estimate the economic impact of teaching and learning activities across the University of Glasgow as a whole52, the analysis captures the enhanced labour market benefits and taxation receipts (minus the costs of attendance/provision) associated with students completing Doctorate degrees at the School of Cancer Sciences, which includes students who are taught in collaboration with the CRUK Scotland Institute (i.e., whose Doctorate degree is supervised by Institute staff).
A2.4.1 The 2021-22 cohort of postgraduate research students taught at the SCS and CRUK Scotland Institute
The analysis of the economic impact of teaching and learning activities focuses on the 2021-22 cohort of UK domiciled students enrolled at the School of Cancer Sciences, i.e., on the 39 UK domiciled students53 who started postgraduate research qualifications at the SCS in 2021-22. This includes 14 students whose Doctorate degree was supervised by a staff member at the CRUK Scotland Institute54, and 25 students supervised by SCS staff instead. In terms of mode of study, most students in the cohort were undertaking their studies on a full-time basis, with few students enrolled on a part-time basis. In terms of domicile, the majority of students in the cohort were from Scotland, with a small number of students domiciled in England or Wales instead.55
A2.4.2 Adjusting for completion rates
To aggregate the individual-level impacts of the SCS’s and CRUK Scotland Institute’s teaching and learning activities, we adjusted the above number of first-year students in the 2021-22 cohort (i.e., the number of ‘starters’) to account for expected completion rates.
To achieve this, we applied the same assumed completion rates as we did for our previous analysis of the economic impact of the University of Glasgow as a whole.56 Specifically, the assumptions were based on the completion outcomes of the 2012-13 and 2013-14 cohorts of the University’s students (i.e. 2012-13 and 2013-14 ‘starters’, with their completion outcomes measured 8 years after the initial enrolment) - broken down by study mode, study intention, and study completion. These completion data capture the number of students (across the two cohorts) who completed their intended qualification, completed a different (usually lower) qualification, or discontinued their studies without being awarded a qualification (for students who originally intended to complete postgraduate degrees, this was modelled as completion at ‘other postgraduate’ level57).
Based on these completion rate data, we assume that, out of the total of 39 students in the 2021-22 cohort of students starting postgraduate research qualifications at the School of Cancer Sciences, 31 students are expected to complete their intended Doctorate degree, while 8 students are expected to complete only one or more modules associated with their degree before dropping out (modelled as completion at ‘other postgraduate’ level).58
A2.4.3 Estimating the returns to higher education qualifications
Our assessment of the returns to higher education qualifications attained at the SCS and the Institute (in the 2021-22 cohort) makes use of our previous estimates of these benefits as part of our analysis of the impact of teaching and learning across the University of Glasgow as a whole (which was based on the cohort of students starting higher education qualifications at the University in 2018-19). While the following provides a brief summary of the underlying methodological approach (including a number of core adjustments made for the analysis here), for further detail, please see our previous report on the economic impact of the University59.
The fundamental objective of the analysis is to estimate the gross and net graduate premium to the individual and the gross and net public purse benefit to the Exchequer associated with higher education qualification attainment (i.e., postgraduate research qualifications in this instance60), defined as follows:
- The gross graduate premium associated with qualification attainment is defined as the present value of enhanced after-tax earnings (i.e., after income tax, National Insurance and VAT are removed, and following the deduction of any foregone earnings during study) relative to an individual in possession of the counterfactual qualification. Here, reflecting the prior attainment levels of students in the 2021-22 cohort of SCS students, all results are estimated relative to individuals in possession of first degrees as the relevant counterfactual;
- The gross benefit to the public purse is defined as the present value of enhanced taxation (i.e. income tax, National Insurance and VAT, following the deduction of the costs of foregone tax earnings during study) relative to an individual in possession of the counterfactual qualification;
- The net graduate premium is defined as the gross graduate premium minus the present value of the direct costs associated with qualification attainment; and
- Similarly, the net benefit to the public purse is defined as the gross public purse benefit minus the direct Exchequer costs of provision during the period of attainment.
As a core component of the analysis, we estimate the labour market return associated with higher education qualifications, rather than simply assessing the labour market outcomes achieved by individuals in possession of these qualifications. The standard approach to estimating this labour market return is to undertake an econometric analysis where the ‘treatment’ group consists of those individuals in possession of the qualification of interest (i.e., postgraduate research qualifications in this instance), and the ‘counterfactual’ group consists of those individuals with comparable personal and socioeconomic characteristics but with the next highest level of qualification (i.e., first degrees in this instance). The rationale for adopting this approach is that the comparison of the earnings and employment outcomes of the treatment group and the counterfactual group ‘strips away’ those other personal and socioeconomic characteristics that might affect labour market earnings and employment (such as gender, age, or sector of employment), leaving just the labour market gains attributable to the qualification itself (see Figure 12 for an illustration of this).
Figure 12 Estimating the gross graduate premium and gross Exchequer benefit
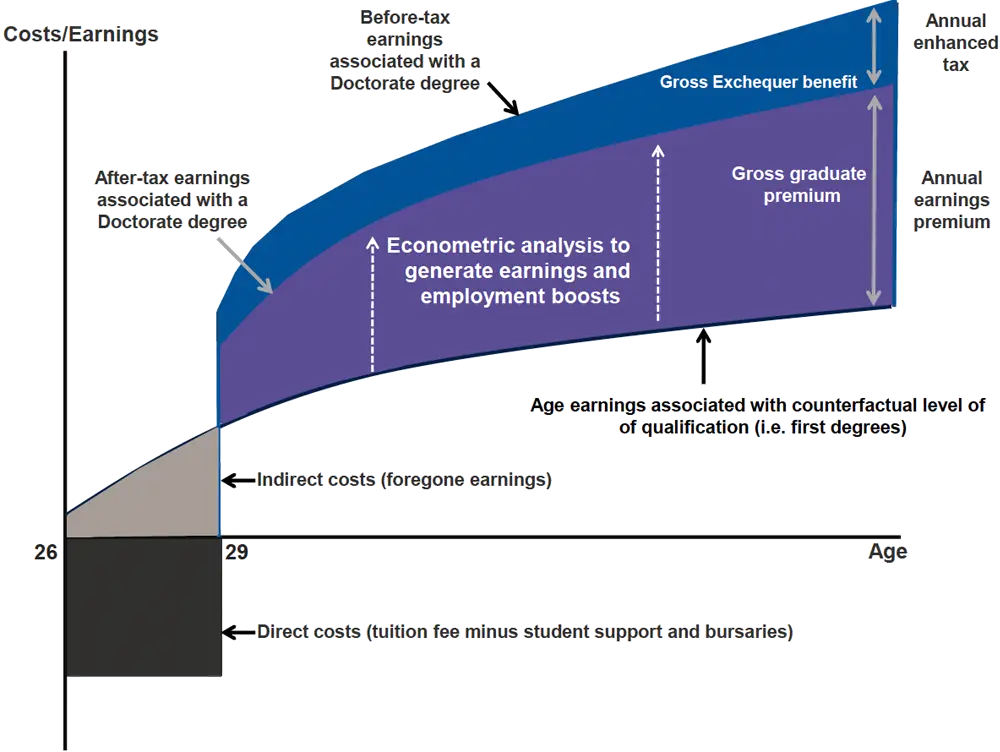
Note: The analysis assumes that the opportunity costs of foregone earnings associated with higher qualification attainment are applicable to full-time students only. For part-time students, we have assumed that these students are able to combine work with their academic studies and as such, do not incur any opportunity costs in the form of foregone earnings. This illustration is based on an assumed average age at enrolment among full-time postgraduate research degree students at the SCS in the 2021-22 cohort of 26, and we have assumed that a full-time postgraduate research degree requires 3 years to complete. Source: London Economics
Based on this econometric analysis, the gross graduate premium is then estimated as the present value of the enhanced post-tax earnings of individuals in possession of postgraduate research degrees (i.e., after income tax, National Insurance and VAT are removed, and following the deduction of foregone earnings) relative to an individual in possession of the counterfactual qualification (i.e., first degrees) – estimated separately by gender and mode of study.
The gross benefits to the Exchequer are derived from the enhanced taxation receipts that are associated with a higher likelihood of being employed, as well as the enhanced earnings associated with more highly skilled and productive employees. Based on the analysis of the lifetime earnings and employment benefits associated with postgraduate research qualification attainment, combined with administrative information on the relevant taxation rates and bands (from HM Revenue and Customs), we estimated the present value of additional income tax, National Insurance and VAT associated with postgraduate research qualification attainment (again relative to first degrees, and separately by gender and mode of study).
The difference between the gross and net graduate premium relates to students’ direct costs of qualification acquisition61. These direct costs refer to the tuition fees paid by the student net of any fee waivers or other bursaries provided by the University of Glasgow, and minus any applicable Postgraduate Doctoral Loans provided by the Student Loans Company (SLC, for students from England and Wales)62,63. In this respect, the student benefit associated with student loan support (where applicable) equals the Resource Accounting and Budgeting charge (RAB charge), capturing the proportion of the loan that is not repaid.
Conversely, this RAB charge constitutes the direct costs64 to the public purse associated with funding postgraduate research students, in relation to the interest rate or write-off subsidies that are associated with Postgraduate Doctoral Loans. Again, the analysis tailors this cost to the student’s specific Home Nation of domicile65.
These direct costs associated with qualification attainment to both students and the Exchequer (by study mode and home nation domicile) are calculated from start to completion of a student’s learning aim. Throughout the analysis, to ensure that the economic impacts are computed in present value terms, all benefits and costs occurring at points in the future were discounted using the standard HM Treasury Green Book real discount rate of 3.5% (see HM Treasury, 2022). Deducting the resulting individual and Exchequer costs from the estimated gross graduate premium and gross public purse benefit, respectively, we arrive at the estimated net graduate premium and net public purse benefit per student.
Based on our previous analysis of the impact of teaching and learning associated with students studying at the University of Glasgow as a whole, for the assessment of the net graduate premium and net Exchequer benefit per student in the relevant 2021-22 SCS cohort, we adjusted our previous estimates for:
- The specific characteristics of students in the cohort. Specifically, the above-described econometric analysis of the labour market returns to higher education qualifications was adjusted to account for the specific subject composition of SCS students, to reflect the significant variation in post-graduation labour market outcomes depending on the subject of study.66 We further adjusted the estimates average age at enrolment67 and study intensity68 among students in the 2021-22 SCS cohort (separately by mode of study); and
- Inflation, to convert the estimates (which were originally calculated in 2018-19 prices) to 2021-22 prices, using CPI inflation data published by the Office for National Statistics (2023a).
All other assumptions remained the same as in our analysis of the impact of the teaching and learning activities of the University of Glasgow as a whole.
References
- Refers to legacy infrastructure.
- Refers to legacy infrastructure.
- Based on staff and financial data provided by the University of Glasgow.
- The total operational expenditure (excluding capital expenditure) of the CRUK Scotland Institute and the School of Cancer Sciences in 2021-22 stood at £51 million. From this, for the purpose of the analysis, we excluded £0.4 million in depreciation costs (from non-staff expenditure) and £1.6 million in movements in pension provisions (from staff expenditure), as it is assumed that these are not relevant from a procurement perspective (i.e., these costs are not accounted for as income by other organisations).
- See Office for National Statistics (2023b).
- The fundamental idea of the multi-regional Input-Output analysis is that region i’s demand for region j’s output is related to the friction involved in shipments from one region to another (which we proxy by the distance between the two regions), and that cross-regional trade can be explained by the relative gross value added of the sector in all regions. The multi-regional Input-Output model was derived by combining UK-level Input-Output tables with data on geographical distances between regions; GVA and compensation of employees by sector and region (Office for National Statistics, 2019); employment by sector and region (Office for National Statistics, 2022a); gross disposable household income by region (Office for National Statistics, 2020); population by region (Office for National Statistics, 2022b); and UK imports into each region and exports by each region, by commodity (Office for National Statistics, 2018).
- In terms of sector breakdown, the original UK Input-Output tables are broken down into 64 (relatively granular) sectors. However, the (wide range of) regional-level data required to generate the multi-regional Input-Output model is not available for such a granular sector breakdown. Instead, the multi-regional Input-Output model is broken down into 10 more high-level sector groups (see Table 8 in Annex A2.2.5 for more information).
- While Input-Output analyses are a useful tool to assess the total economic impacts generated by a wide range of activities, it is important to note several key limitations associated with this type of analysis. Input-Output analyses assume that inputs are complements, and that there are constant returns to scale in the production function (i.e., that there are no economies of scale). The interpretation of these assumptions is that the prevailing breakdown of inputs from all sectors (employees, and imports) in 2016 is a good approximation of the breakdown that would prevail if total demand (and therefore output) were marginally different. In addition, Input-Output analyses do not account for any price effects resulting from a change in demand for a given industry/output.
- Specifically, the analysis makes use of Type II multipliers, defined as [Direct + indirect + induced impact]/[Direct impact].
- In other words, this approach asserts that the spending patterns of the CRUK Scotland Institute and the School of Cancer Sciences reflect the average spending patterns across organisations operating in Scotland’s professional and support activities sector, and Scotland’s government, health, and education sector, respectively.
- In addition to the impacts on Scotland and the UK as whole, the analysis estimates a full breakdown across all regions, as well as by sector. These detailed results are presented in Figure 9 and Figure 10 in Annex A2.2.4.
- The bursary support to UK domiciled students is considered as a benefit to the student in the analysis of the impact of teaching and learning (see Section 5). It was therefore necessary to deduct these bursaries from the direct impact of the CRUK Scotland Institute’s and the School of Cancer Sciences’ spending to correctly take account of the fact that these bursaries are a transfer from the institutions to students, and not an additional benefit to the UK economy.
- Again, the analysis is based on the CRUK Scotland Institute’s 2021-22 financial year (i.e., April 2021 to March 2022).
- ie, UK central government bodies, Local Authorities, and health and hospital authorities.
- For more detail on the implementation of the QALY methodology within economic impact assessments, see HM Treasury’s (2022) Green Book.
- Such labour market benefits have been quantified in other studies (e.g., Hilhorst and Lockey (2019)), but are not accounted for here. Therefore, the estimated benefits are likely to under-estimate the true economic impact benefits of the Institute’s and the SCS’s research.
- Glover et al. (2014)’s benefit figures use value of £25,000 per QALY (in 2011 prices), but the best practice QALY value has since been updated to £70,000 (in 2020 prices) (see HM Treasury’s Green Book (HM Treasury, 2022)). Therefore, the study’s original QALY benefit figures were re-calculated using a QALY value of £60,129 (which represents a £70,000 QALY figure converted to 2011 prices using CPI inflation (Office for National Statistics, 2023)).
The multiplier was then calculated based on the level of public and charity cancer research funding invested in 1976 and the resulting estimated total net QALY benefits associated with this funding (adjusted for the difference in QALY values) that were incurred between 1991 and 2010 (all in 2011 prices). In line with Glover et al.’s analysis, these calculations assume that it takes 15 years for cancer research to result in patient benefits, and that these benefits then last for 20 years (i.e., that the patient benefits associated with cancer research funding provided in 1976 occurred between 1991 and 2010). The benefits were aggregated over the 20-year period and discounted to net present value (NPV) terms using a 1.5% real discount rate (based on HM Treasury (2022) Green Book guidance on the best practice real discount rate to use for the estimation of QALYs in NPV terms). Dividing the benefits by the associated level of investment, this allowed us to calculate the QALY return on cancer research as a monetary multiplier.
We also undertook sensitivity checks in relation to model assumptions around time lags and effect duration, which did not substantially change the identified multiplier. - The core relevant literature used here focuses exclusively on the net QALY benefits associated with UK publicly funded and charity funded cancer research but excludes privately funded research (and only limited research exists on any corresponding effects associated with privately funded research of this type). While it is likely that privately funded cancer research also carries substantial benefits, we interpret the literature conservatively, by estimating only the net QALY benefits associated with UK publicly and charity funded research (and assuming that the QALY benefits associated with other types of research funding are zero). 45 Note that this benefit will take place over many years in the future, but is discounted to net present values in 2021-22 prices (using a 1.5% real discount rate (as per HM Treasury (2022) Green Book guidance)). 46 Sussex et al. (2016) do not specify an exact timeframe over which the impact occurs. They report that 44% of the impact occurs within one year, with the remainder expected to occur over multiple subsequent decades. For this analysis, as there is no specific information on the timeframe for the remaining 56% of impact, we have assumed that the crowded-in research takes place within the same financial year as the CRUK Scotland Institute’s and SCS’s research. This assumption is likely to have a relatively minor impact on the estimated multiplier, given that nearly half of the impact occurs in the first year.
- Note that this benefit will take place over many years in the future, but is discounted to net present values in 2021-22 prices (using a 1.5% real discount rate (as per HM Treasury (2022) Green Book guidance)).
- Sussex et al. (2016) do not specify an exact timeframe over which the impact occurs. They report that 44% of the impact occurs within one year, with the remainder expected to occur over multiple subsequent decades. For this analysis, as there is no specific information on the timeframe for the remaining 56% of impact, we have assumed that the crowded-in research takes place within the same financial year as the CRUK Scotland Institute’s and SCS’s research. This assumption is likely to have a relatively minor impact on the estimated multiplier, given that nearly half of the impact occurs in the first year.
- Specifically, this adjustment is made to avoid double-counting with the indirect and induced effect associated with the Institute’s and the SCS’s expenditure that was funded through private research income (see Section 3).
- ie, research income received from sources other than UK public sources or UK charities.
- Note that the figures here do not add up precisely due to rounding.
- Again, the relevant multiplier is based on the above-described Input-Output analysis (see Section 3 and Annex A2.2.2). We make use of the estimated economic multiplier associated with the UK scientific R&D sector as a whole (as opposed to a multiplier specifically associated with the economic activity of the Scottish scientific R&D sector), as it is not known where in the UK the additional crowded-in privately funded R&D takes place. In this case, compared to the multi-regional Input-Output analysis described in Section 3 and Annex A2.2.2, the multiplier here is based on the more granular industry breakdown available from the UK-wide Input-Output tables (also see Table 8 in Annex A2.2.3).
- All students in the relevant cohort were undertaking postgraduate research qualifications; specifically, all of these students were enrolled in Doctorate degrees. Throughout this report, we therefore use the terms ‘postgraduate research qualifications’ and ‘Doctorate degrees’ interchangeably.
- Again, see London Economics (2021).
- In addition, there were 29 non-UK domiciled students who started postgraduate research qualifications at the SCS in 2021-22.It is possible that a proportion of these international students will remain in the UK to work following completion of theirstudies (and, similarly, that UK domiciled students might decide to leave the UK to pursue their careers in other countries).However, given the uncertainty in predicting the extent to which this is the case, and the difficulty in assessing the net labourmarket returns for students not resident in the UK post-graduation, the analysis of teaching and learning focuses on UK domiciled students only. In other words, we assume that all UK domiciled students will enter the UK labour market upongraduation, and that non-UK students will leave the UK upon completing their qualifications at the SCS.
- This includes Institute staff who were either the primary or secondary supervisor of the relevant students’ postgraduate research degree work.
- Again, the analysis here focuses on UK domiciled students only.
- Again, see London Economics (2021).
- In other words, we assume that students who started but dropped out of postgraduate studies were assumed to at least complete one or several standalone modules associated with their intended qualification, so that these students’ completion outcomes were modelled as completion at ‘other postgraduate’ level. As a result, the total assumed completion rates sum up to 100%.
- Note that the assumed completion rates here are based on University of Glasgow data for students in any subject of study, rather than focusing only on those relevant subjects taught at the SCS. Most students in the 2021-22 cohort of School of Cancer Sciences students were undertaking Doctorate degrees in Medicine (as compared to a much wider subject mix for student enrolled across the range of University of Glasgow schools and colleges). As we assume that the completion rates among Medicine students are typically higher than the average completion rates across all subjects of study taught at the University of Glasgow as a whole, it is expected that the assumed completion rates here somewhat underestimate the ‘true’ completion rates among students attending the SCS specifically.
- Again, see London Economics (2021).
- As well as ‘other postgraduate’ learning, for those students in the 2021-22 cohort who are expected to only complete one or more module of their intended Doctorate degree at the SCS before discontinuing their studies.
- Note again that the indirect costs associated with qualification attainment, i.e., foregone earnings during the period of study (for full-time students only), are already deducted from the gross graduate premium.
- Given the differing approach to public support funding for students from each of the UK Home Nations, the direct costs incurred by students were assessed separately for students from Scotland, England, and Wales. While English and Welsh domiciled students undertaking Doctorate degrees (anywhere in the UK) have access to Postgraduate Doctoral Loans (from the SLC) to help finance their tuition fees and/or living costs, there is currently no corresponding support scheme available to Scottish domiciled Doctorate degree students from the Students Awards Agency for Scotland (SAAS). As a result, we have assumed that there is no student support available for Scottish domiciled students in the relevant 2021-22 SCS cohort.
- Note again that there were no students in the 2021-22 cohort of SCS students that were domiciled in Northern Ireland.
- Again, any indirect costs to the public purse in terms of foregone income tax, National Insurance and VAT receipts foregone during the period of qualification attainment (applicable to full-time students only) are already deducted as part of the gross public purse benefits.
- Our previous analysis of the impact of teaching and learning of higher education qualifications attained at the University of Glasgow as a whole (London Economics, 2021) also took account of the additional Exchequer cost of teaching grant funding administered by the Scottish Funding Council (SFC). However, we assume that this teaching grant funding typically does not apply to students undertaking postgraduate research qualifications, so this cost was excluded from the analysis here.
- In other words, the marginal earnings and employment returns associated with postgraduate research qualifications here are adjusted for the fact that most students in the 2021-22 cohort of School of Cancer Sciences students were undertaking Doctorate degrees in Medicine (as compared to a much wider subject mix for student enrolled across the range of University of Glasgow schools and colleges), where the labour market returns associated with qualifications in Medicine subjects are typically significantly larger than the corresponding labour market returns to qualifications in other subjects.
Note that, as a conservative approach, the net graduate premiums and Exchequer benefits associated with completion at ‘other postgraduate’ level (i.e., for students in the SCS cohort who are expected to drop out of their studies after completing one or several modules associated with their intended Doctorate degree) have not been adjusted for the specific subject mix of SCS students. Instead, they are based on average marginal earnings and employment returns across all subjects of study (i.e., across all graduates included in the underlying Labour Force Survey data on which the analysis is based, irrespective of subject of study), to ensure that these returns for ‘non-completers’ are not overestimated. - Specifically, based on the above-mentioned HESA student data provided by the SCS, we assumed an average age at enrolment of students in the 2021-22 SCS cohort of 26 for students enrolled in full-time Doctorate degrees, and 36 for students undertaking Doctorate degrees on a part-time basis (this compares to 27 and 39 for full-time and part-time postgraduate research students in the overall 2018-19 cohort of University of Glasgow students, respectively; see London Economics (2021)).
- The average study intensity (separately by study mode) was calculated by dividing the number of students in the cohort in full-time equivalents by the corresponding number of students in terms of headcount (again based on HESA data provided by the University of Glasgow). The resulting average study intensity assumptions then fed into the assumed average tuition fees for part-time students, as well as the estimated fee waivers and other bursaries for full-time and part-time students (again, see London Economics (2021) for further detail).