

Inclusive Economies Systems Mapping
Collaborative creation with SIPHER policy partners
Our topic focus on Inclusive Economies began with a process of participatory systems mapping activities involving our three original SIPHER policy partners; Greater Manchester Combined Authority, Sheffield City Council and the Scottish Government (via Clackmannanshire Council).
The development of these initial maps took place during the initial phase of the Covid-19 lockdown so we had to adapt traditional workshop methods to enable stakeholders to participate remotely.
Read: Participatory Systems Mapping in a Socially Distanced World - Blog
We created an Inclusive Economy policy system 'Mega Map’ developed for three individual maps - co-created with each SIPHER policy partner.
Inclusive Economy Policy System Mega Map
- Sheffield Inclusive Economy Systems Map
- Greater Manchester Inclusive Economy Systems Map
- Clackmannanshire Inclusive Economy Systems Map
These maps can be interrogated by data analysts to better understand the cascading effects that arise when an initiating cause in one part of the system has knock-on effects on other parts, due to interdependencies.
Read: Cascading effects in participatory systems mapping - Blog
The systems mapping exercise carried out with Clackmannanshire Council also helped to inform the development of the Scottish Government’s Wellbeing Economy Toolkit which sets out a stage-by-stage diagnostic process designed to aid decision making and prioritisation of economic interventions to facilitate the transition to local and regional wellbeing economies.
Integration and Simplification
Engagement with SIPHER’s Inclusive Economy topic experts (Professor Ruth Lupton and Ceri Hughes) allowed us to simplify and aggregate the different systems maps, and begin to evaluate the extent to which they aligned with the wider evidence and theories of change around inclusive economies.
This process included an exercise exploring how the detailed nodes on the map could be aggregated up to broader themes including Employment, Environmental Sustainability, and Health and Wellbeing.
Following this feedback we consolidated the maps into a single integrated map. This integrated map although simplified is still highly complex and it includes many variables which are difficult to quantify. These variables are not included in our SIPHER models however, they are still important for policymakers and researchers to consider within the wider context of inclusive economy systems.
This map is SIPHER’s baseline systems perspective on inclusive economies. It is closely aligned to the themes that are represented in our Inclusive Economy Indicators which were developed in parallel.
Further, significantly smaller iterations of the simplified map were then required in order to develop visualisations of specific parts of the system which we have translated into computational models using the best available data sources.
Investigating Causal Processes at Local Authority Level
SIPHER’s Causal System Dynamics Modelling - Workstrand 4 is investigating the dynamics and feedback effects of higher order causal processes at local authority level e.g. the relationship between unemployment and mental health.
The map which underpins the Dynamic Systems model was developed from our Inclusive Economy Indicators, again with support from our Inclusive Economy experts.
Here, we can more clearly see the expected causal connections that exist within the system and how they impact on health outcomes via the QALE (Quality Adjusted Life Expectancy) measure, over a period of time.
- QALE Causal loop diagram - pending
A final process of refinement removed some indicators that had weak data consistency (e.g. involuntary exclusion from the labour market). The resulting map is now being used to model different income related policy scenarios at local authority level.
Policy Microsimulation
SIPHER Policy Microsimulation - Workstrand 5 is modelling the impact of policy changes on the characteristics of individuals and households, showing how policy impacts are likely to differ across geographical and societal groups.
The SIPHER MINOS model required the development of another systems map which shows the expected impact of policy changes on an individual level.
The Income-Mental Health Causal Loop diagram, developed by SIPHER Director, Petra Meier and health inequalities expert, Clare Bambra illustrates the different ways in which changes to income can impact, either positively or negatively on an individual’s mental health.
For example, a positive impact could be that having more disposable income may lead to increased quality of social interactions which could then open up opportunities for creating better support networks for someone who was previously experiencing social isolation.
The Income-Mental Health Causal Loop diagram was used to identify five key variables (or pathways) through which changes in income could have an impact on mental health.
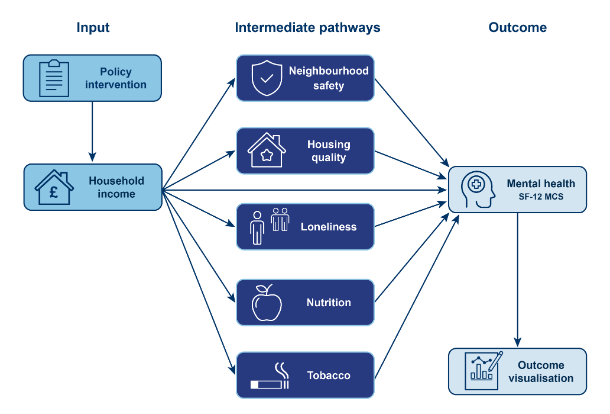
- SIPHER MINOS Model - Policy Pathways
These five variables were chosen to include in our SIPHER Microsimulation For Interrogation Of Social And Health Systems - MINOS model because they could be mapped to high quality longitudinal data available through the UK Household Longitudinal Study (Understanding Society) which is the basis of our SIPHER Synthetic Population Dataset.
One notable exclusion from the MINOS model is alcohol.
We do not model the impact of household income on health via alcohol consumption because the evidence shows that whilst higher income is associated with greater alcohol consumption, this does not appear to translate into more health harm in affluent groups.
The Income-Mental Health Causal Loop diagram has also been developed into an interactive map which provides access to thematically grouped evidence of the causal connections that exist between income and mental health.