Modelling in space & time
Our researchers design methods to model and interpret patterns in data that change across time and space.

Staff
Postgraduate research students
Refine By
-
{{student.surname}} {{student.forename}}
{{student.surname}} {{student.forename}}
({{student.subject}})
{{student.title}}
Modelling in Space and Time - Example Research Projects
Information about postgraduate research opportunities and how to apply can be found on the Postgraduate Research Study page. Below is a selection of projects that could be undertaken with our group.
Collective animal movement and resource selection in changing environments (PhD)
Supervisors: Mu Nui, Paul Blackwell (Sheffield), Juan Morales (MVLS, UoG)
Relevant research groups: Modelling in Space and Time, Machine Learning and AI, Environmental, Ecological Sciences and Sustainability
Funding: This project is competitively funded through The Leverhulme Programme for Doctoral Training in Ecological Data Science.
Advances in technologies such as GPS have revolutionized the tracking of wildlife, providing detailed data on how animals move and interact. It is now feasible to track multiple animals simultaneously, at high frequency and for long periods. This project explores the movement of animals both individually and in groups, focusing on how environmental factors and resource availability shape their behaviours. Animals in groups often move interdependently, influenced by interactions between individuals. However, traditional movement models primarily address individual animals and ignore these group dynamics. On the other hand, collective movement models are often parameterized with short-term data. This research will develop innovative statistical models to better understand how animals move collectively. Such movement necessarily involves each individual responding to their physical environment, as well as other group members, and a key aspect of this project is understanding how animals use space and resources within the group setting. Incorporating both these aspects of short-term movement decisions and long-term space use in a coherent mathematical model will illuminate how animals collectively adapt to their surroundings. It will use cutting-edge statistical and machine learning methods, such as diffusion models. The findings and methodology developed will provide valuable insights into animal behaviour and ecology, supporting conservation efforts and helping manage human impacts on wildlife.
Extreme value theory for predicting animal dispersal and movement in a changing climate (PhD)
Supervisors: Jafet Belmont Osuna, Daniela Castro-Camilo, Juan Morales (MVLS, UoG)
Relevant research groups: Modelling in Space and Time, Environmental, Ecological Sciences and Sustainability
Funding: This project is competitively funded through The Leverhulme Programme for Doctoral Training in Ecological Data Science.
There is an imperative need to understand and predict how populations respond to multiple aspects of global change, such as habitat fragmentation and climate change. Extreme weather events, which are expected to increase in both frequency and intensity, can profoundly impact animal movement and spatial dynamics. Additionally, for many species, rare long-distance dispersal events play a crucial role in reaching suitable habitats for germination, establishment, and colonisation across fragmented or managed landscapes. Many plant species, for instance, rely on birds for dispersal—birds ingest fruits and later deposit seeds through defecation or regurgitation. Accurately predicting such processes requires models that capture both seed retention times within birds and bird movement patterns. This project aims to develop and apply cutting-edge statistical methods for analysing animal movement and dispersal data using Extreme-Value Theory (EVT) within a Bayesian framework. EVT, a well-established theoretical framework that has been widely used in environmental sciences for modelling extreme events, has seen limited application in ecology. We will leverage EVT to (1) understand how extreme weather events can affect animal movement, and (2) to make better predictions of dispersal processes. This work offers substantial potential for novel insights and methodological advancements. By integrating experimental research and state-of-the-art tracking technologies, the project will inform the development of hierarchical Bayesian models to explore patterns and drivers of animal movement and dispersal, with a particular focus on extreme behaviours and their ecological implications.
Leveraging large language models to provide insights into global plant biodiversity (PhD)
Supervisors: Richard Reeve (MVLS, UoG), Jake Lever (CS, UoG), Vinny Davies, Neil Brummitt (NHM), Ana Claudia Araujo (NHM), Ben Scott (NHM)
Relevant research groups: Modelling in Space and Time, Machine Learning and AI, Environmental, Ecological Sciences and Sustainability
Funding: This project is competitively funded through The Leverhulme Programme for Doctoral Training in Ecological Data Science.
Plants are fundamental to the provision of ecosystem services, and we are wholly dependent on them for survival. Yet, globally, many plant species are under threat of extinction. We need a comprehensive plant trait dataset as input to the next generation of biodiversity-climate models. The lack of such a dataset means that existing approaches focus on limited "Plant Functional Types" and cannot estimate the impacts of climate and land use change on individual species or help inform decision making on mitigating biodiversity loss. The needed plant trait data, from niche preferences to growth rates, are locked in the text of the vast botanical literature of the Biodiversity Heritage Library and other texts available to the Natural History Museum. This studentship would use the recent advances in large language models (LLMs) and natural language processing (NLP) to extract this information. We have developed an ecosystem modelling tool (EcoSISTEM, Harris et al., 2023, https://github.com/EcoJulia/EcoSISTEM.jl) that captures survival, competition and reproduction among multiple plant species across a landscape. LLMs will enable extraction of traits data for integration into the EcoSISTEM infrastructure and enable the inclusion of multilingual records, expanding the system's geographic and historical range. By addressing these enormous data gaps, the student will then explore global spatial and temporal variability in functional and other trait-based diversity measures to produce a unique and comprehensive evaluation of whether predictors exist of diversity at a global scale. Ultimately, the project will boost EcoSISTEM's ability to simulate plant responses to climate change with greater accuracy.
The impact of deep learning optimization and design choices for marine biodiversity monitoring (PhD)
Supervisors: Tiffany Vlaar, Laurence De Clippele (MVLS, UoG)
Relevant research groups: Modelling in Space and Time, Machine Learning and AI, Environmental, Ecological Sciences and Sustainability
Funding: This project is competitively funded through The Leverhulme Programme for Doctoral Training in Ecological Data Science.
This project aims to increase the efficiency, accuracy, and reliability of annotation and classification of large marine datasets using deep learning. Timely and accurate analysis of these long-term datasets will aid marine biodiversity monitoring efforts. Design of more efficient strategies further aims to reduce the carbon footprint of training and fine-tuning large machine learning models. The project is expected to lead to various novel insights for the machine learning community such as on optimal pre-training choices for downstream robust performance, the optimal order of learning samples with varying complexity levels, navigating instances with label ground truth uncertainty, and re-evaluation of metric design. The PhD student will be supported in building international collaborations with researchers across different disciplines and in developing effective research communication skills.
Sampling strategies for environmental monitoring networks (PhD)
Supervisors: Claire Miller, Craig Alexander, Craig Wilkie
Relevant research groups: Modelling in Space and Time, Environmental, Ecological, and Sustainability
Funding: This project has specific funding available. More information can be found at the FindAPhD Advert.
In recent years, there has been a lot of work done on investigating how to monitor environmental variables in the most efficient way. Environmental variables, such as pollutants in water, can be monitored through, for example, in-situ sampling, automatic in-situ sensors or remote sensing. However, each sampling approach has different levels of accuracy and is available at different spatial and temporal resolutions.
Environmental regulators and industry all have a responsibility and commitment to monitoring environmental standards and mitigating the potential for increases to levels of pollutants. At a time of world-wide budgetary pressures, the most efficient monitoring schemes are required. However, the mechanisms of monitoring can also be detrimental to the environment e.g. through more visits to a site or lab/computer processing creating a higher environmental footprint.
The aim of the PhD is to extend work already carried out on the optimal design of monitoring networks for spatiotemporal models. Specifically, to identify the spatiotemporal sampling designs that can balance budgetary requirements and environmental impact, with a view to developing and enhancing online tools (e.g. GWSDAT) to provide automatic guidance to practitioners. The latter can then integrate this guidance into their assessment and development of the most optimal monitoring network. This will require statistical methodological development, working on computationally efficient implementations and software development.
The PhD will be jointly supervised by partners from industry and hence the successful candidate will additionally engage in knowledge exchange/transfer, training and networking in this sector.
Evaluating probabilistic forecasts in high-dimensional settings (PhD)
Supervisors: Jethro Browell
Relevant research groups: Modelling in Space and Time, Computational Statistics, Applied Probability and Stochastic Processes
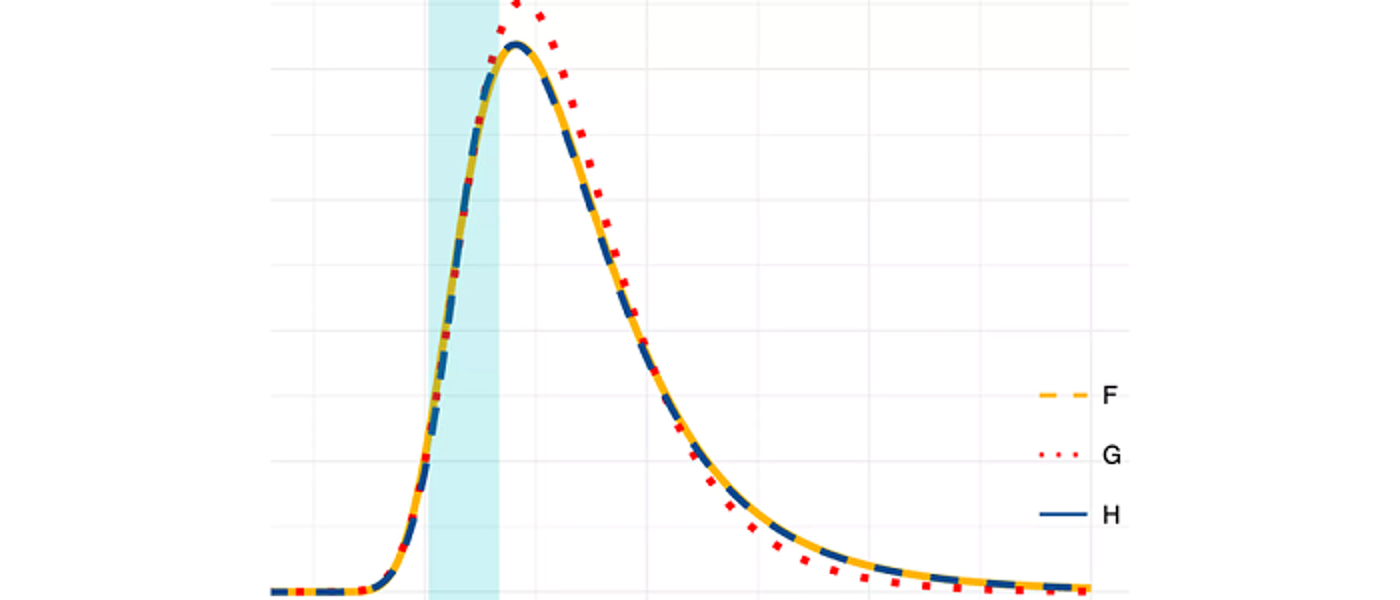
Many decisions are informed by forecasts, and almost all forecasts are uncertain to some degree. Probabilistic forecasts quantify uncertainty to help improve decision-making and are playing an important role in fields including weather forecasting, economics, energy, and public policy. Evaluating the quality of past forecasts is essential to give forecasters and forecast users confidence in their current predictions, and to compare the performance of forecasting systems.
While the principles of probabilistic forecast evaluation have been established over the past 15 years, most notably that of “sharpness subject to calibration/reliability”, we lack a complete toolkit for applying these principles in many situations, especially those that arise in high-dimensional settings. Furthermore, forecast evaluation must be interpretable by forecast users as well as expert forecasts, and assigning value to marginal improvements in forecast quality remains a challenge in many sectors.
This PhD will develop new statistical methods for probabilistic forecast evaluation considering some of the following issues:
- Verifying probabilistic calibration conditional on relevant covariates
- Skill scores for multivariate probabilistic forecasts where “ideal” performance is unknowable
- Assigning value to marginal forecast improvement though the convolution of utility functions and Murphey Diagrams
- Development of the concept of “anticipated verification” and “predicting the of uncertainty of future forecasts”
- Decomposing forecast misspecification (e.g. into spatial and temporal components)
- Evaluation of Conformal Predictions
Good knowledge of multivariate statistics is essential, prior knowledge of probabilistic forecasting and forecast evaluation would be an advantage.
Adaptive probabilistic forecasting (PhD)
Supervisors: Jethro Browell
Relevant research groups: Modelling in Space and Time, Computational Statistics, Applied Probability and Stochastic Processes
Data-driven predictive models depend on the representativeness of data used in model selection and estimation. However, many processes change over time meaning that recent data is more representative than old data. In this situation, predictive models should track these changes, which is the aim of “online” or “adaptive” algorithms. Furthermore, many users of forecasts require probabilistic forecasts, which quantify uncertainty, to inform their decision-making. Existing adaptive methods such as Recursive Least Squares, the Kalman Filter have been very successful for adaptive point forecasting, but adaptive probabilistic forecasting has received little attention. This PhD will develop methods for adaptive probabilistic forecasting from a theoretical perspective and with a view to apply these methods to problems in at least one application area to be determined.
In the context of adaptive probabilistic forecasting, this PhD may consider:
- Online estimation of Generalised Additive Models for Location Scale and Shape
- Online/adaptive (multivariate) time series prediction
- Online aggregation (of experts, or hierarchies)
A good knowledge of methods for time series analysis and regression is essential, familiarity with flexible regression (GAMs) and distributional regression (GAMLSS/quantile regression) would be an advantage.
The evolution of shape (PhD)
Supervisors: Vincent Macaulay
Relevant research groups: Bayesian Modelling and Inference, Modelling in Space and Time, Statistical Modelling for Biology, Genetics and *omics
Shapes of objects change in time. Organisms evolve and in the process change form: humans and chimpanzees derive from some common ancestor presumably different from either in shape. Designed objects are no different: an Art Deco tea pot from the 1920s might share some features with one from Ikea in 2010, but they are different. Mathematical models of evolution for certain data types, like the strings of As, Gs , Cs and Ts in our evolving DNA, are quite mature and allow us to learn about the relationships of the objects (their phylogeny or family tree), about the changes that happen to them in time (the evolutionary process) and about the ways objects were configured in the past (the ancestral states), by statistical techniques like phylogenetic analysis. Such techniques for shape data are still in their infancy. This project will develop novel statistical inference approaches (in a Bayesian context) for complex data objects, like functions, surfaces and shapes, using Gaussian-process models, with potential application in fields as diverse as language evolution, morphometrics and industrial design.
New methods for analysis of migratory navigation (PhD)
Supervisors: Janine Illian, Urška Demšar (University of St Andrews)
Relevant research groups: Modelling in Space and Time, Bayesian Modelling and Inference, Computational Statistics, Environmental, Ecological Sciences and Sustainability
Migratory birds travel annually across vast expanses of oceans and continents to reach their destination with incredible accuracy. How they are able to do this using only locally available cues is still not fully understood. Migratory navigation consists of two processes: birds either identify the direction in which to fly (compass orientation) or the location where they are at a specific moment in time (geographic positioning). One of the possible ways they do this is to use information from the Earth’s magnetic field in the so-called geomagnetic navigation (Mouritsen, 2018). While there is substantial evidence (both physiological and behavioural) that they do sense magnetic field (Deutschlander and Beason, 2014), we however still do not know exactly which of the components of the field they use for orientation or positioning. We also do not understand how rapid changes in the field affect movement behaviour.
There is a possibility that birds can sense these rapid large changes and that this may affect their navigational process. To study this, we need to link accurate data on Earth’s magnetic field with animal tracking data. This has only become possible very recently through new spatial data science advances: we developed the MagGeo tool, which links contemporaneous geomagnetic data from Swarm satellites of the European Space Agency with animal tracking data (Benitez Paez et al., 2021).
Linking geomagnetic data to animal tracking data however creates a highly-dimensional data set, which is difficult to explore. Typical analyses of contextual environmental information in ecology include representing contextual variables as co-variates in relatively simple statistical models (Brum Bastos et al., 2021), but this is not sufficient for studying detailed navigational behaviour. This project will analyse complex spatio-temporal data using computationally efficient statistical model fitting approches in a Bayesian context.
This project is fully based on open data to support reproducibility and open science. We will test our new methods by annotating publicly available bird tracking data (e.g. from repositories such as Movebank.org), using the open MagGeo tool and implementing our new methods as Free and Open Source Software (R/Python).
Integrated spatio-temporal modelling for environmental data (PhD)
Supervisors: Janine Illian, Peter Henrys (UKCEH)
Relevant research groups: Modelling in Space and Time, Bayesian Modelling and Inference, Computational Statistics, Environmental, Ecological Sciences and Sustainability
The last decade has seen a proliferation of environmental data with vast quantities of information available from various sources. This has been due to a number of different factors including: the advent of sensor technologies; the provision of remotely sensed data from both drones and satellites; and the explosion in citizen science initiatives. These data represent a step change in the resolution of available data across space and time - sensors can be streaming data at a resolution of seconds whereas citizen science observations can be in the hundreds of thousands.
Over the same period, the resources available for traditional field surveys have decreased dramatically whilst logistical issues (such as access to sites, ) have increased. This has severely impacted the ability for field survey campaigns to collect data at high spatial and temporal resolutions. It is exactly this sort of information that is required to fit models that can quantify and predict the spread of invasive species, for example.
Whilst we have seen an explosion of data across various sources, there is no single source that provides both the spatial and temporal intensity that may be required when fitting complex spatio-temporal models (cf invasive species example) - each has its own advantages and benefits in terms of information content. There is therefore potentially huge benefit in beginning together data from these different sources within a consistent framework to exploit the benefits each offers and to understand processes at unprecedented resolutions/scales that would be impossible to monitor.
Current approaches to combining data in this way are typically very bespoke and involve complex model structures that are not reusable outside of the particular application area. What is needed is an overarching generic methodological framework and associated software solutions to implement such analyses. Not only would such a framework provide the methodological basis to enable researchers to benefit from this big data revolution, but also the capability to change such analyses from being stand alone research projects in their own right, to more operational, standard analytical routines.
FInally, such dynamic, integrated analyses could feedback into data collection initiatives to ensure optimal allocation of effort for traditional surveys or optimal power management for sensor networks. The major step change being that this optimal allocation of effort is conditional on other data that is available. So, for example, given the coverage and intensity of the citizen science data, where should we optimally send our paid surveyors? The idea is that information is collected at times and locations that provide the greatest benefit in understanding the underpinning stochastic processes. These two major issues - integrated analyses and adaptive sampling - ensure that environmental monitoring is fit for purpose and scientists, policy and industry can benefit from the big data revolution.
This project will develop an integrated statistical modelling strategy that provides a single modelling framework for enabling quantification of ecosystem goods and services while accounting for the fundamental differences in different data streams. Data collected at different spatial resolutions can be used within the same model through projecting it into continuous space and projecting it back into the landscape level of interest. As a result, decisions can be made at the relevant spatial scale and uncertainty is propagated through, facilitating appropriate decision making.
Statistical methodology for assessing the impacts of offshore renewable developments on marine wildlife (PhD)
Supervisors: Janine Illian, Esther Jones (BIOSS), Adam Butler (BIOSS)
Relevant research groups: Modelling in Space and Time, Bayesian Modelling and Inference, Computational Statistics, Environmental, Ecological Sciences and Sustainability
Assessing the impacts of offshore renewable developments on marine wildlife is a critical component of the consenting process. A NERC-funded project, ECOWINGS, will provide a step-change in analysing predator-prey dynamics in the marine environment, collecting data across trophic levels against a backdrop of developing wind farms and climate change. Aerial survey and GPS data from multiple species of seabirds will be collected contemporaneously alongside prey data available over the whole water column from an automated surface vehicle and underwater drone.
These methods of data collection will generate 3D space and time profiles of predators and prey, creating a rich source of information and enormous potential for modelling and interrogation. The data present a unique opportunity for experimental design across a dynamic and changing marine ecosystem, which is heavily influenced by local and global anthropogenic activities. However, these data have complex intrinsic spatio-temporal properties, which are challenging to analyse. Significant statistical methods development could be achieved using this system as a case study, contributing to the scientific knowledge base not only in offshore renewables but more generally in the many circumstances where patchy ecological spatio-temporal data are available.
This PhD project will develop spatio-temporal modelling methodology that will allow user to anaylse these exciting - and complex - data sets and help inform our knowledge on the impact of off-shore renewable on wildlife.
Analysis of spatially correlated functional data objects (PhD)
Supervisors: Surajit Ray
Relevant research groups: Modelling in Space and Time, Computational Statistics, Nonparametric and Semi-parametric Statistics, Imaging, Image Processing and Image Analysis
Historically, functional data analysis techniques have widely been used to analyze traditional time series data, albeit from a different perspective. Of late, FDA techniques are increasingly being used in domains such as environmental science, where the data are spatio-temporal in nature and hence is it typical to consider such data as functional data where the functions are correlated in time or space. An example where modeling the dependencies is crucial is in analyzing remotely sensed data observed over a number of years across the surface of the earth, where each year forms a single functional data object. One might be interested in decomposing the overall variation across space and time and attribute it to covariates of interest. Another interesting class of data with dependence structure consists of weather data on several variables collected from balloons where the domain of the functions is a vertical strip in the atmosphere, and the data are spatially correlated. One of the challenges in such type of data is the problem of missingness, to address which one needs develop appropriate spatial smoothing techniques for spatially dependent functional data. There are also interesting design of experiment issues, as well as questions of data calibration to account for the variability in sensing instruments. Inspite of the research initiative in analyzing dependent functional data there are several unresolved problems, which the student will work on:
- robust statistical models for incorporating temporal and spatial dependencies in functional data
- developing reliable prediction and interpolation techniques for dependent functional data
- developing inferential framework for testing hypotheses related to simplified dependent structures
- analysing sparsely observed functional data by borrowing information from neighbours
- visualisation of data summaries associated with dependent functional data
- Clustering of functional data
Estimating the effects of air pollution on human health (PhD)
Supervisors: Duncan Lee
Relevant research groups: Modelling in Space and Time, Biostatistics, Epidemiology and Health Applications
The health impact of exposure to air pollution is thought to reduce average life expectancy by six months, with an estimated equivalent health cost of 19 billion each year (from DEFRA). These effects have been estimated using statistical models, which quantify the impact on human health of exposure in both the short and the long term. However, the estimation of such effects is challenging, because individual level measures of health and pollution exposure are not available. Therefore, the majority of studies are conducted at the population level, and the resulting inference can only be made about the effects of pollution on overall population health. However, the data used in such studies are spatially misaligned, as the health data relate to extended areas such as cities or electoral wards, while the pollution concentrations are measured at individual locations. Furthermore, pollution monitors are typically located where concentrations are thought to be highest, known as preferential sampling, which is likely to result in overly high measurements being recorded. This project aims to develop statistical methodology to address these problems, and thus provide a less biased estimate of the effects of pollution on health than are currently produced.
Mapping disease risk in space and time (PhD)
Supervisors: Duncan Lee
Relevant research groups: Modelling in Space and Time, Biostatistics, Epidemiology and Health Applications
Disease risk varies over space and time, due to similar variation in environmental exposures such as air pollution and risk inducing behaviours such as smoking. Modelling the spatio-temporal pattern in disease risk is known as disease mapping, and the aims are to: quantify the spatial pattern in disease risk to determine the extent of health inequalities, determine whether there has been any increase or reduction in the risk over time, identify the locations of clusters of areas at elevated risk, and quantify the impact of exposures, such as air pollution, on disease risk. I am working on all these related problems at present, and I have PhD projects in all these areas.
Bayesian Mixture Models for Spatio-Temporal Data (PhD)
Supervisors: Craig Anderson
Relevant research groups: Modelling in Space and Time, Bayesian Modelling and Inference, Biostatistics, Epidemiology and Health Applications
The prevalence of disease is typically not constant across space – instead the risk tends to vary from one region to another. Some of this variability may be down to environmental conditions, but many of them are driven by socio-economic differences between regions, with poorer regions tending to have worse health than wealthier regions. For example, within the the Greater Glasgow and Clyde region, where the World Health Organisation noted that life expectancy ranges from 54 in Calton to 82 in Lenzie, despite these areas being less than 10 miles apart. There is substantial value to health professionals and policymakers in identifying some of the causes behind these localised health inequalities.
Disease mapping is a field of statistical epidemiology which focuses on estimating the patterns of disease risk across a geographical region. The main goal of such mapping is typically to identify regions of high disease risk so that relevant public health interventions can be made. This project involves the development of statistical models which will enhance our understanding regional differences in the risk of suffering from major diseases by focusing on these localised health inequalities.
Standard Bayesian hierarchical models with a conditional autoregressive prior are frequently used for risk estimation in this context, but these models assume a smooth risk surface which is often not appropriate in practice. In reality, it will often be the case that different regions have vastly different risk profiles and require different data generating functions as a result.
In this work we propose a mixture model based approach which allows different sub-populations to be represented by different underlying statistical distributions within a single modelling framework. By integrating CAR models into mixture models, researchers can simultaneously account for spatial dependencies and identify distinct disease patterns within subpopulations.
Detecting hotspots of water pollution in complex constrained domains and networks (PhD)
Supervisors: Mu Niu, Craig Wilkie, Cathy Yi-Hsuan Chen (Business School, UofG), Michael Tso (Lancaster University)
Relevant research groups: Modelling in Space and Time, Bayesian Modelling and Inference, Environmental, Ecological Sciences & Sustainability
Funding: This project is competitively funded through the ExaGEO DLA.
Technological developments with smart sensors are changing the way that the environment is monitored. Many such smart systems are under development, with small, energy efficient, mobile sensors being trialled. Such systems offer opportunities to change how we monitor the environment, but this requires additional statistical development in the optimisation of the location of the sensors.
The aim of this project is to develop a mathematical and computational inferential framework to identify optimal sensor deployment locations within complex, constrained domains and networks for improved water contamination detection. Methods for estimating covariance functions in such domains rely on computationally intensive diffusion process simulations, limiting their application to relatively simple domains and small-scale datasets. To address this challenge, the project will employ accelerated computing paradigms with highly parallelized GPUs to enhance simulation efficiency. The framework will also address regression, classification, and optimization problems on latent manifolds embedded in high-dimensional spaces, such as image clouds (e.g., remote sensing satellite images), which are crucial for sensor deployment and performance evaluation. As the project progresses, particularly in the image cloud case, the computational demands will intensify, requiring advanced GPU resources or exascale computing to ensure scalability, efficiency, and performance.
Downscaling and Prediction of Rainfall Extremes from Climate Model Outputs (PhD)
Supervisors: Sebastian Gerhard Mutz (GES, UoG), Daniela Castro-Camilo
Relevant research groups: Modelling in Space and Time, Bayesian Modelling and Inference, Environmental, Ecological Sciences & Sustainability
Funding: This project is competitively funded through the ExaGEO DLA.
In the last decade, Scotland’s rainfall increased by 9% annually and 19% in winter, with more water from extreme events, posing risks to the environment, infrastructure, health, and industry. Urgent issues such as flooding, mass wasting, and water quality are closely tied to rainfall extremes. Reliable predictions of extremes are, therefore, critical for risk management. Prediction of extremes, which is one of the main focuses of extreme value theory, is still considered one of the grand challenges by the World Climate Research Programme. This project will address this challenge by developing novel statistical, computationally efficient models that are able to predict rainfall extremes from the output of GPU-optimised climate models.
Exploring Hybrid Flood modelling leveraging GPU/Exascale computing (PhD)
Supervisors: Andrew Elliott, Lindsay Beevers (University of Edinburgh), Claire Miller, Michele Weiland (University of Edinburgh)
Relevant research groups: Modelling in Space and Time, Environmental, Ecological Sciences & Sustainability, Machine Learning and AI, Emulation and Uncertainty Quantification
Funding: This project is competitively funded through the ExaGEO DLA.
Flood modelling is crucial for understanding flood hazards, now and in the future as a result of climate change. Modelling provides inundation extents (or flood footprints) which provide outlines of areas at risk which can help to manage our increasingly complex infrastructure network as our climate changes. Our ability to make fast, accurate predictions of fluvial inundation extents is important for disaster risk reduction. Simultaneously capturing uncertainty in forecasts or predictions is essential for efficient planning and design. Both aims require methods which are computationally efficient whilst maintaining accurate predictions. Current Navier-stokes physics-based models are computationally intensive; thus this project would explore approaches to hybrid flood models which utilise GPU-compute and ML fused with physics-based models, as well as investigating scaling the numerical models to large-scale HPC resources.
Scalable approaches to mathematical modelling and uncertainty quantification in heterogeneous peatlands (PhD)
Supervisors: Raimondo Penta, Vinny Davies, Jessica Davies (Lancaster University), Lawrence Bull, Matteo Icardi (University of Nottingham)
Relevant research groups: Modelling in Space and Time, Environmental, Ecological Sciences & Sustainability, Machine Learning and AI, Emulation and Uncertainty Quantification, Continuum Mechanics
Funding: This project is competitively funded through the ExaGEO DLA.
While only covering 3% of the Earth’s surface, peatlands store >30% of terrestrial carbon and play a vital ecological role. Peatlands are, however, highly sensitive to climate change and human pressures, and therefore understanding and restoring them is crucial for climate action. Multiscale mathematical models can represent the complex microstructures and interactions that control peatland dynamics but are limited by their computational demands. GPU and Exascale computing advances offer a timely opportunity to unlock the potential benefits of mathematically-led peatland modelling approaches. By scaling these complex models to run on new architectures or by directly incorporating mathematical constraints into GPU-based deep learning approaches, scalable computing will to deliver transformative insights into peatland dynamics and their restoration, supporting global climate efforts.
Scalable Inference and Uncertainty Quantification for Ecosystem Modelling (PhD)
Supervisors: Vinny Davies, Richard Reeve (BOHVM, UoG), David Johnson (Lancaster University), Christina Cobbold, Neil Brummitt (Natural History Museum)
Relevant research groups: Modelling in Space and Time, Environmental, Ecological Sciences & Sustainability, Machine Learning and AI, Emulation and Uncertainty Quantification
Funding: This project is competitively funded through the ExaGEO DLA.
Understanding the stability of ecosystems and how they are impacted by climate and land use change can allow us to identify sites where biodiversity loss will occur and help to direct policymakers in mitigation efforts. Our current digital twin of plant biodiversity – https://github.com/EcoJulia/EcoSISTEM.jl – provides functionality for simulating species through processes of competition, reproduction, dispersal and death, as well as environmental changes in climate and habitat, but it would benefit from enhancement in several areas. The three this project would most likely target are the introduction of a soil layer (and the improvement of the modelling of soil water); improving the efficiency of the code to handle a more complex model and to allow stochastic and systematic Uncertainty Quantification (UQ); and developing techniques for scalable inference of missing parameters.
Statistical Emulation Development for Landscape Evolution Models (PhD)
Supervisors: Benn Macdonald, Mu Niu, Paul Eizenhöfer (GES, UoG), Eky Febrianto (Engineering, UoG)
Relevant research groups: Modelling in Space and Time, Environmental, Ecological Sciences & Sustainability, Machine Learning and AI, Emulation and Uncertainty Quantification
Funding: This project is competitively funded through the ExaGEO DLA.
Many real-world processes, including those governing landscape evolution, can be effectively mathematically described via differential equations. These equations describe how processes, e.g. the physiography of mountainous landscapes, change with respect to other variables, e.g. time and space. Conventional approaches for performing statistical inference involve repeated numerical solving of the equations. Every time parameters of the equations are changed in a statistical optimisation or sampling procedure; the equations need to be re-solved numerically. The associated large computational cost limits advancements when scaling to more complex systems, the application of statistical inference and machine learning approaches, as well as the implementation of more holistic approaches to Earth System science. This yields to the need for an accelerated computing paradigm involving highly parallelised GPUs for the evaluation of the forward problem.
Beyond advanced computing hardware, emulation is becoming a more popular way to tackle this issue. The idea is that first the differential equations are solved as many times as possible and then the output is interpolated using statistical techniques. Then, when inference is carried out, the emulator predictions replace the differential equation solutions. Since prediction from an emulator is very fast, this avoids the computational bottleneck. If the emulator is a good representation of the differential equation output, then parameter inference can be accurate.
The student will begin by working on parallelising the numerical solver of the mathematical model via GPUs. This means that many more solutions can be generated on which to build the emulator, in a timeframe that is feasible. Then, they will develop efficient emulators for complex landscape evolution models, as the PhD project evolves.
Seminars
Regular seminars relevant to the group are held as part of the Statistics seminar series. The seminars cover various aspects across the AI3 initiative and usually span multiple groups. You can find more information on the Statistics seminar series page, where you can also subscribe to the seminar series calendar.
The main application areas the Modelling in Space and Time group work on include environmental, ecological and epidemiological contexts, where seasonal patterns, spatial hotspots and spatio-temporal correlations are all common data features. Collectively, the group develop novel methodologies that build upon state-of-the-art modelling approaches, including additive models, conditional autoregressive models, point process models and machine learning methods.
The group are also committed to reproducible research and open science, being the authors of widely used software packages in R such as CARBayesST and inlabru to allow others to implement the methods developed. With large active grants like GALLANT and active collaborations with the World Health Organisation, Public Health Scotland and industry leaders across a range of different industries, the group is one of the biggest in the school, with strong connections across multiple other research groups.