

Accent Change in Glaswegian: Final report
Annexe 3: Figures
Figure 1
Map of Glasgow showing approximate locations of the two areas relevant to the study: 'Bearsden' (middle-class) and 'Maryhill' (working-class). From Macafee (1983: 18).
Figure 2a
Principal component analysis plot for read speech. In PCA the variation for all speakers for all variables is linked together, and an overall pattern is presented in the form of the principal components, the first describing the pattern that is used most often, the second which is used most often after the first, and so on. Here the plot shows a correlation between the first principal component and our factors of Age and Class (i.e. the horizontal spread). Working-class adolescents are clustered and isolated to the far left of the plot, middle-class adults are generally to the far right.
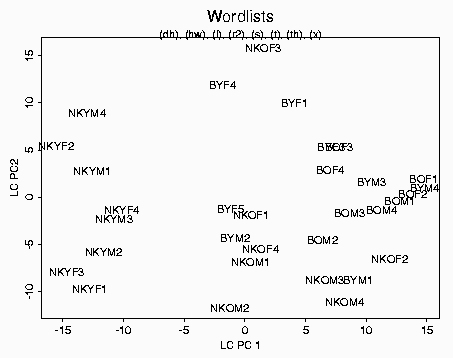
Key to informant coding for Figures 2 and 3: NK ~ WC; B ~ MC; O ~ old; Y ~ young; M ~ male; F ~ female.
Figure 2b
Principal component analysis plot for conversational speech. Again, working-class adolescents are to the far left of the plot, and middle-class adults generally to the far right.
Figure 3a
Tree diagram from cluster analysis for read speech. The branched clusters represent how similar speakers are with respect to their entire variation. Depth on the chart is also a factor; clusters at the base of the diagram represent the closest relationships. The speakers show a class split with only working-class adults grouped with middle-class speakers.
Figure 3b
Tree diagram from cluster analysis for conversational speech. Here the groupings are more complex, but we still find identifiable clusters: note the group of working-class adolescents to the far right, and the core group of middle-class adults.
Figure 4
Variance in PCA scores. The variability of the positioning of the age/class groups on the PCA plots is given in the chart below. A lower figure represents speakers close on the plots (a cohesive unit), a higher figure shows that the speakers are more spread out (less cohesive). Working-class adolescents show the lowest variability, and hence are a consistent group. Middle-class adults are also relatively consistent. Working-class adults and middle-class adolescents are much more variable.
Figure 5a
Loadings plot for read speech. This plot shows the contribution of variant usage to the positioning of speakers in the PCA plot (Figure 2a above). Variants to the far right of the plot are those which contribute most to the position of middle-class adults - these are all consistent with the regional standard. Variants to the far left of the plot account most for the position of the working-class adolescents - these are all non-standard, both local and non-local. (Variants within the box have no relationship with the factors, Age/Class, e.g. those for (s) which pattern according to Gender.)
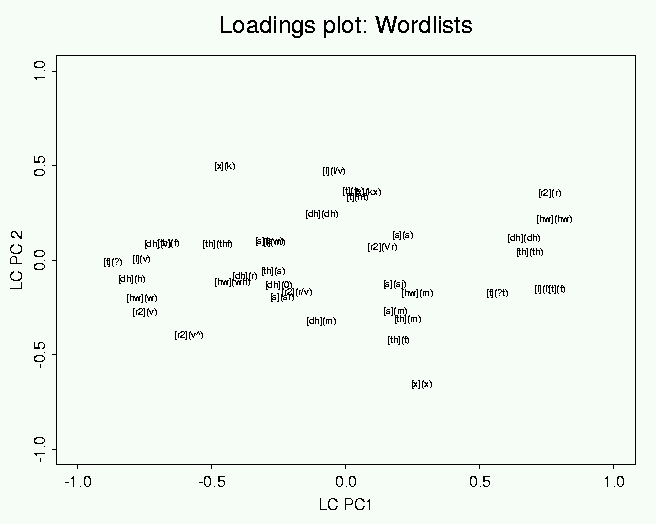
Figure 5b
Loadings plot for conversational speech. Again, the variants to the right of the plot, which contribute most to the position of the middle-class adults in Figure 2b, are characteristic of Scottish Standard English, those to the far left, contributing to the position of the working-class adolescents, are non-standard, local and non-local.
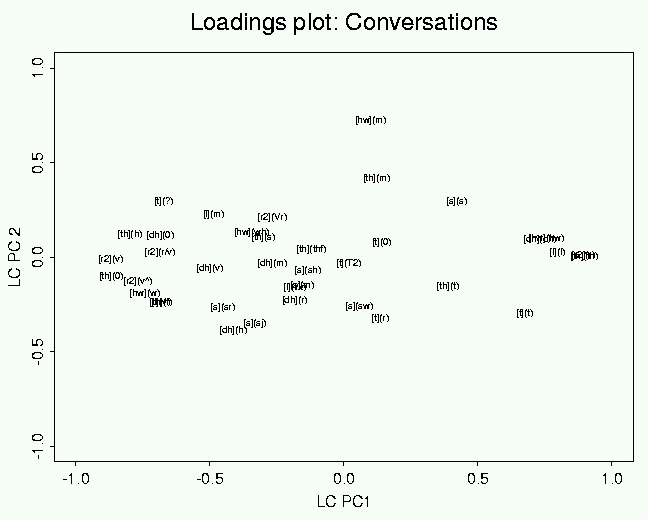
Figure 6
Gender patterning in the acoustic characteristics of /s/ for the Glasgow sample. The scatter plot shows the distribution of two measurements ('mean'/ 'spread') calculated from the overall energy spectrum of /s/ at the midpoint of the fricative (algorithm provided by A. Wrench, QMUC, Edinburgh). The mean value reflects the overall pitch of the fricative, which is expected to be higher for female than male speakers. Here females are higher than males overall (all below 6000Hz), but there are outliers, in particular 5 girls, including all four working-class girls, who cluster within the male range. This demonstrates that the articulation of /s/ is not simply dependent on biological constraints of sex, but can be finely controlled to signal gender and social group membership.
Figure 7
Example of raw data: the spread of variation identified for working-class men for (hw) in conversational speech.
Figure 8a
Acoustic waveform and spectrogram of loch pronounced with the velar fricative [x] by a middle-class girl. The waveform shows acoustic energy over time, the spectrogram acoustic energy analysed according to frequency over time. Note the long period of frication noise with a low main resonance characteristic of a velar fricative.
Figure 8b
Acoustic waveforms and spectrograms of loch (top) and lock (bottom) both with a velar stop [k], from a working-class boy. Both pronunciations show the expected characteristics of silent portion, burst, and following aspiration typical of a stop articulation.
Figure 8c
Acoustic waveform and spectrogram of loch with an 'intermediate' variant from a working-class girl. We find acoustic features characteristic of stops and fricatives together: the silent gap and small burst typical of a stop, but at the same time, a period of frication noise typical of a fricative.
Figure 9a
Sociolinguistic patterning of 'diffusion' variables for read and conversational speech: TH-fronting.
Significant effects of Age, Class, and Age/Class interaction.
Significant factors of Age, Class, Gender, and all interactions
In this and Figures 10 and 11, values on the vertical axis are percentages and the horizontal axis gives social groups determined by the results of the log-ratio linear analysis. WC ~ working-class; MC ~ middle-class; O ~ old; Y ~ young; M ~ male; F ~ female. The Scottish standard variant is always the lowest part of the column, in white. [m] refers to phonetically miscellaneous variants, [0] to deletion, [V] to vowel (grouped together given the enormous range of variants).
2 [thf] represents variants auditorily between [th] and [f].
Figure 9b
Sociolinguistic patterning of 'diffusion' variables for read and conversational speech: DH-fronting.
Significant factors of Age, Class and Age/Class interaction
Significant factors of Age and Class
Figure 9c
Sociolinguistic patterning of 'diffusion' variables for read and conversational speech: L-vocalization.
[l/V] represents variants auditorily between [l] and [V].
No significant effects
Significant effects of Age, Class and Age/Class interaction
Figure 10a
Sociolinguistic patterning of 'retention' variables for read and conversational speech: T-glottalling.
* [T] represents voiced [t].
Significant effects of Age, Class and Age/Class interaction
Significant effect of Class
Figure 10b
Sociolinguistic patterning of 'retention' variables for read and conversational speech: S-retraction.
* [sr] represents 'tip raised' variants, [sj] palatalized variants, and [sw] 'whistled' variants.
Significant effect of Gender
Significant effect of Gender
Figure 11a
Sociolinguistic patterning of 'loss' variables for read and conversational speech: X-loss.
* [kx] represents variants auditorily between [x] and [k].
No significant effects (data sparse)
Too little data for statistical analysis
Figure 11b
Sociolinguistic patterning of 'loss' variables for read and conversational speech: HW-loss.
* [wh] represents variants auditorily between [hw] and [w].
No significant effects (data sparse)
Significant effects of Age, Class and Age/Gender interaction
Figure 11c
Sociolinguistic patterning of 'loss' variables for read and conversational speech: R-loss.
* [r/V] represents variants auditorily between [r] and [V]; [V^] represents velarized vowel variants; [Vr] represents rhotacized vowel variants.
Significant effect of Class
Significant effect of Class Significant effects of Age, Class and Gender, and Age/Class and Class/Gender interactions